9/29/09 System 824 Views 5-27
• Status
• SPL history graph
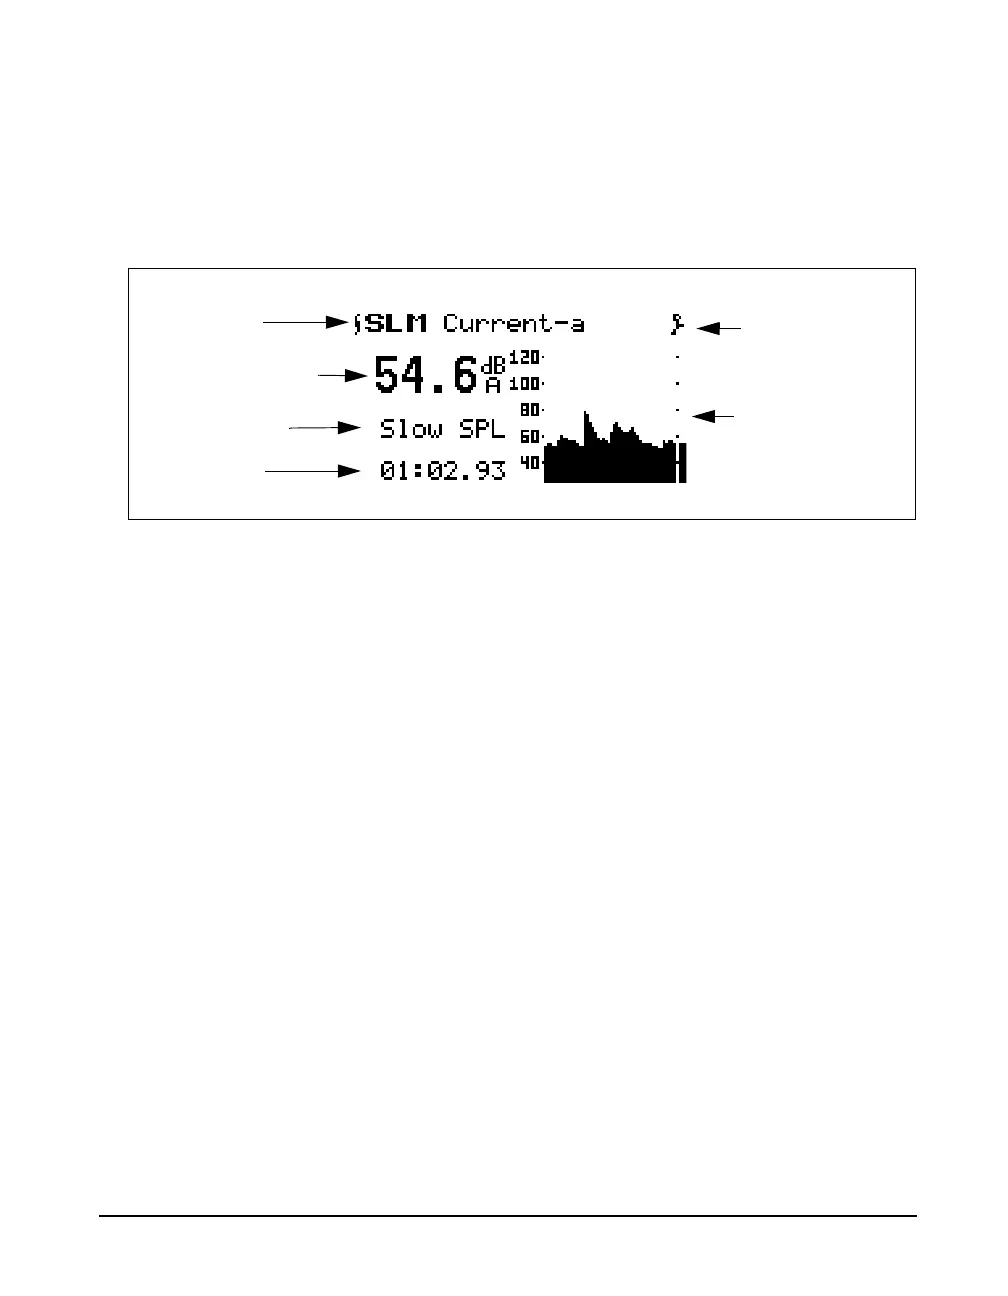
The Current SLM-a or SPL display is shown below:
The following discusses each of these display components:
Display label - This shows the current display (in this
example, “SLM Current-a”). The display represents both
Current-a and Overall-a display.
Current reading and weight setting - Displays the current
SPL reading. This level is also shown graphically by the bar
on the far right of the SPL history graph. The frequency
weighting for SPL can be either A, C, or FLAT.
Detector setting - The current detector is indicated (for
example, Slow SPL) and can be Slow, Fast, or Impl.
Elapsed time - This displays the length of time the current
measurement has been running. It will reset to zero when the
R Reset key is pressed (Current SLM only). It will also
pause when the
p Pause key is pressed and then continue
when it is pressed again. The timer is displayed as mm:ss.ss,
hh:mm:ss or hhhhh:mm.
SPL history graph - Shows a recent history of one second
Leq readings. The far right bar displays the current SPL
reading. As readings are taken, they are placed onto the
scrolling graph from right to left once per second.
Display label
Current SPL reading
Detector setting
Status
SPL history graph
Elapsed time
and weight setting