Common Analysis and Display Functions
R&S
®
FSW
503User Manual 1173.9411.02 ─ 43
(See Chapter 9.3.3.1, "Marker Search Settings", on page 524).
Tip: To navigate within long marker peak lists, simply scroll through the entries with
your finger on the touchscreen.
Remote command:
LAY:ADD? '1',RIGH, PEAK, see LAYout:ADD[:WINDow]? on page 1015
Results:
CALCulate<n>:MARKer<m>:X on page 1156
CALCulate<n>:MARKer<m>:Y on page 1169
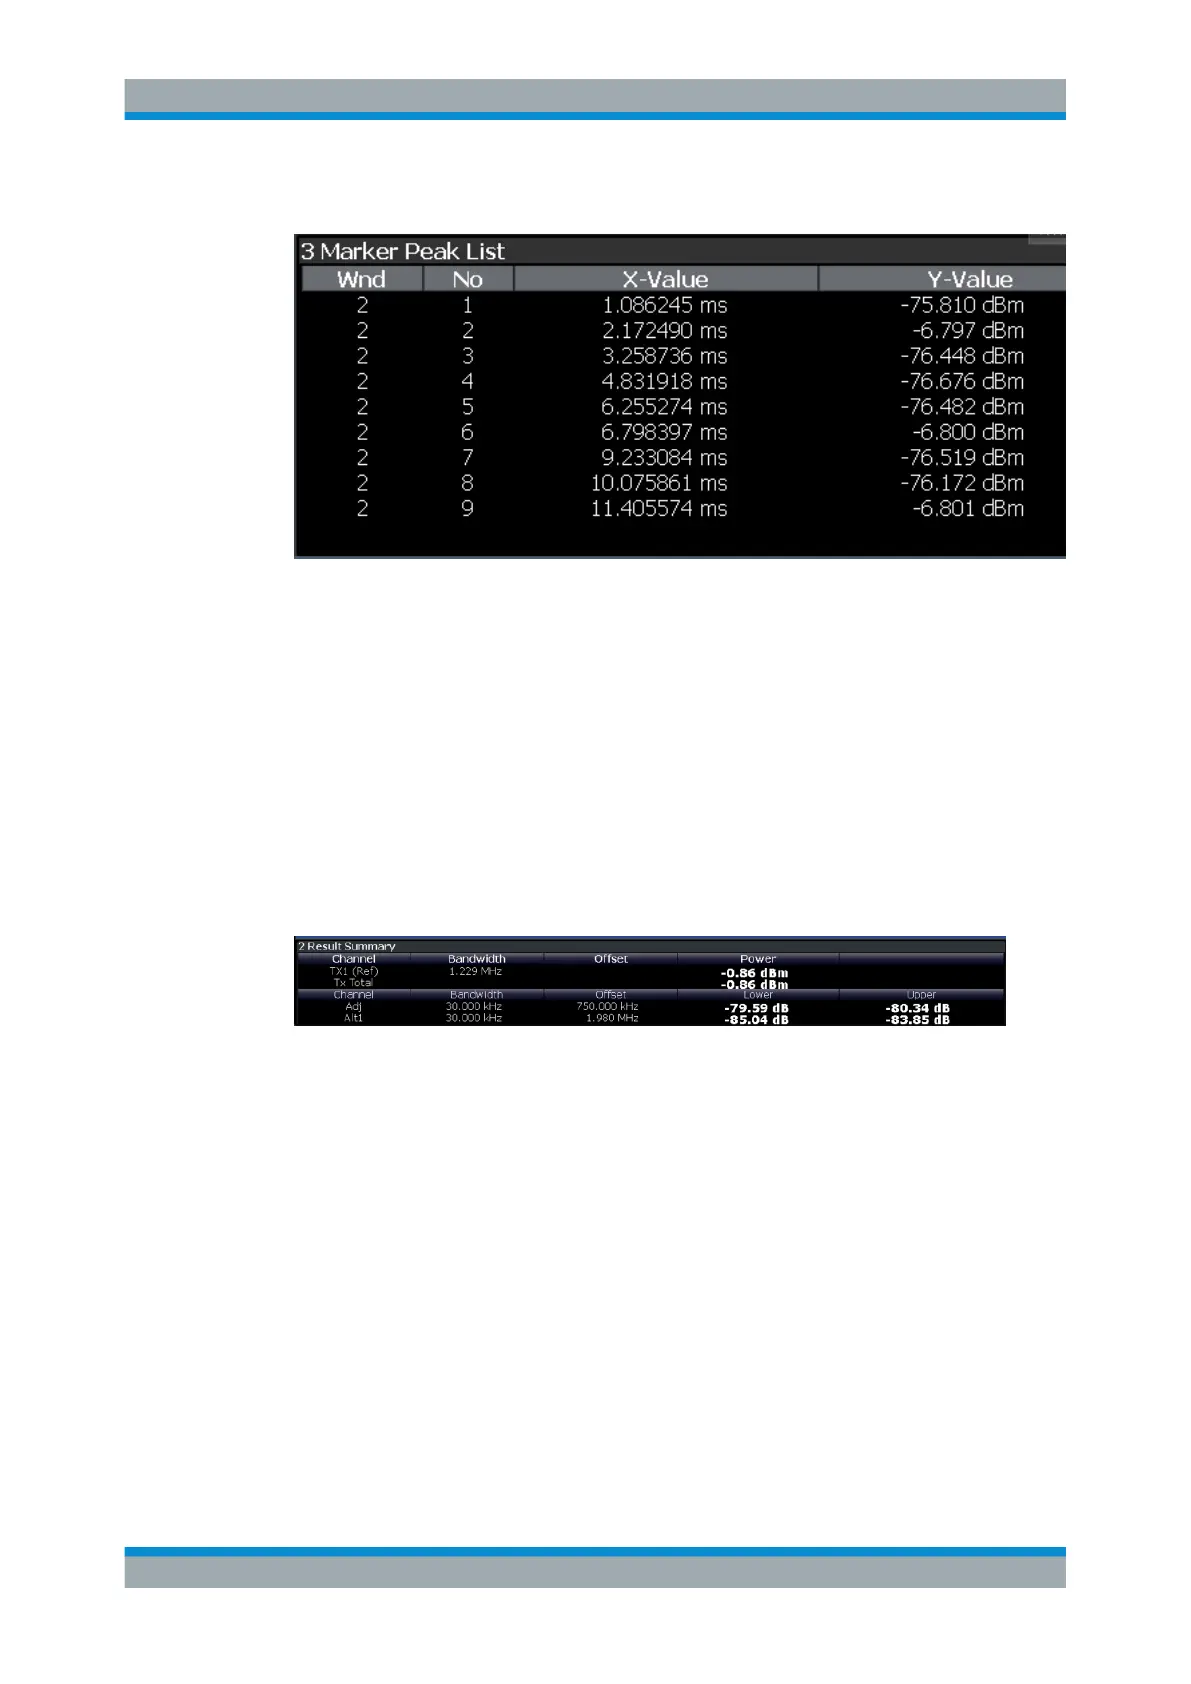
Result Summary
Result summaries provide the results of specific measurement functions in a table for
numerical evaluation. The contents of the result summary vary depending on the
selected measurement function. See the description of the individual measurement
functions for details.
Tip: To navigate within long result summary tables, simply scroll through the entries
with your finger on the touchscreen.
Remote command:
LAY:ADD? '1',RIGH, RSUM, see LAYout:ADD[:WINDow]? on page 1015
Spectrogram
A spectrogram shows how the spectral density of a signal varies over time. The x-axis
shows the frequency or sweep time, the y-axis shows the measurement time. A third
dimension, the power level, is indicated by different colors. Thus you can see how the
strength of the signal varies over time for different frequencies.
The spectrogram display consists of two diagrams: the standard spectrum result dis-
play (upper diagram) and the spectrogram result display (lower diagram).
For details see Chapter 9.5.2.1, "Working with Spectrograms", on page 588.
Remote command:
LAY:ADD? '1',RIGH, SGR, see LAYout:ADD[:WINDow]? on page 1015
Result Display Configuration
 Loading...


