Common Analysis and Display Functions
R&S
®
FSW
535User Manual 1173.9411.02 ─ 43
the RMS value of white noise. With a logarithmic level axis, 1.45 dB is added addi-
tionally. Logarithmic averaging is thus fully taken into account, which yields a value
that is 1.45 dB lower than that of linear averaging.
●
To allow for a more stable noise display, eight trace points on each side of the mea-
surement frequency are averaged.
●
For span > 0, the measured values are averaged versus time (after a sweep).
The R&S FSW noise figure can be calculated from the measured power density level.
It is calculated by deducting the set RF attenuation (RF Att) from the displayed noise
level and adding 174 to the result.
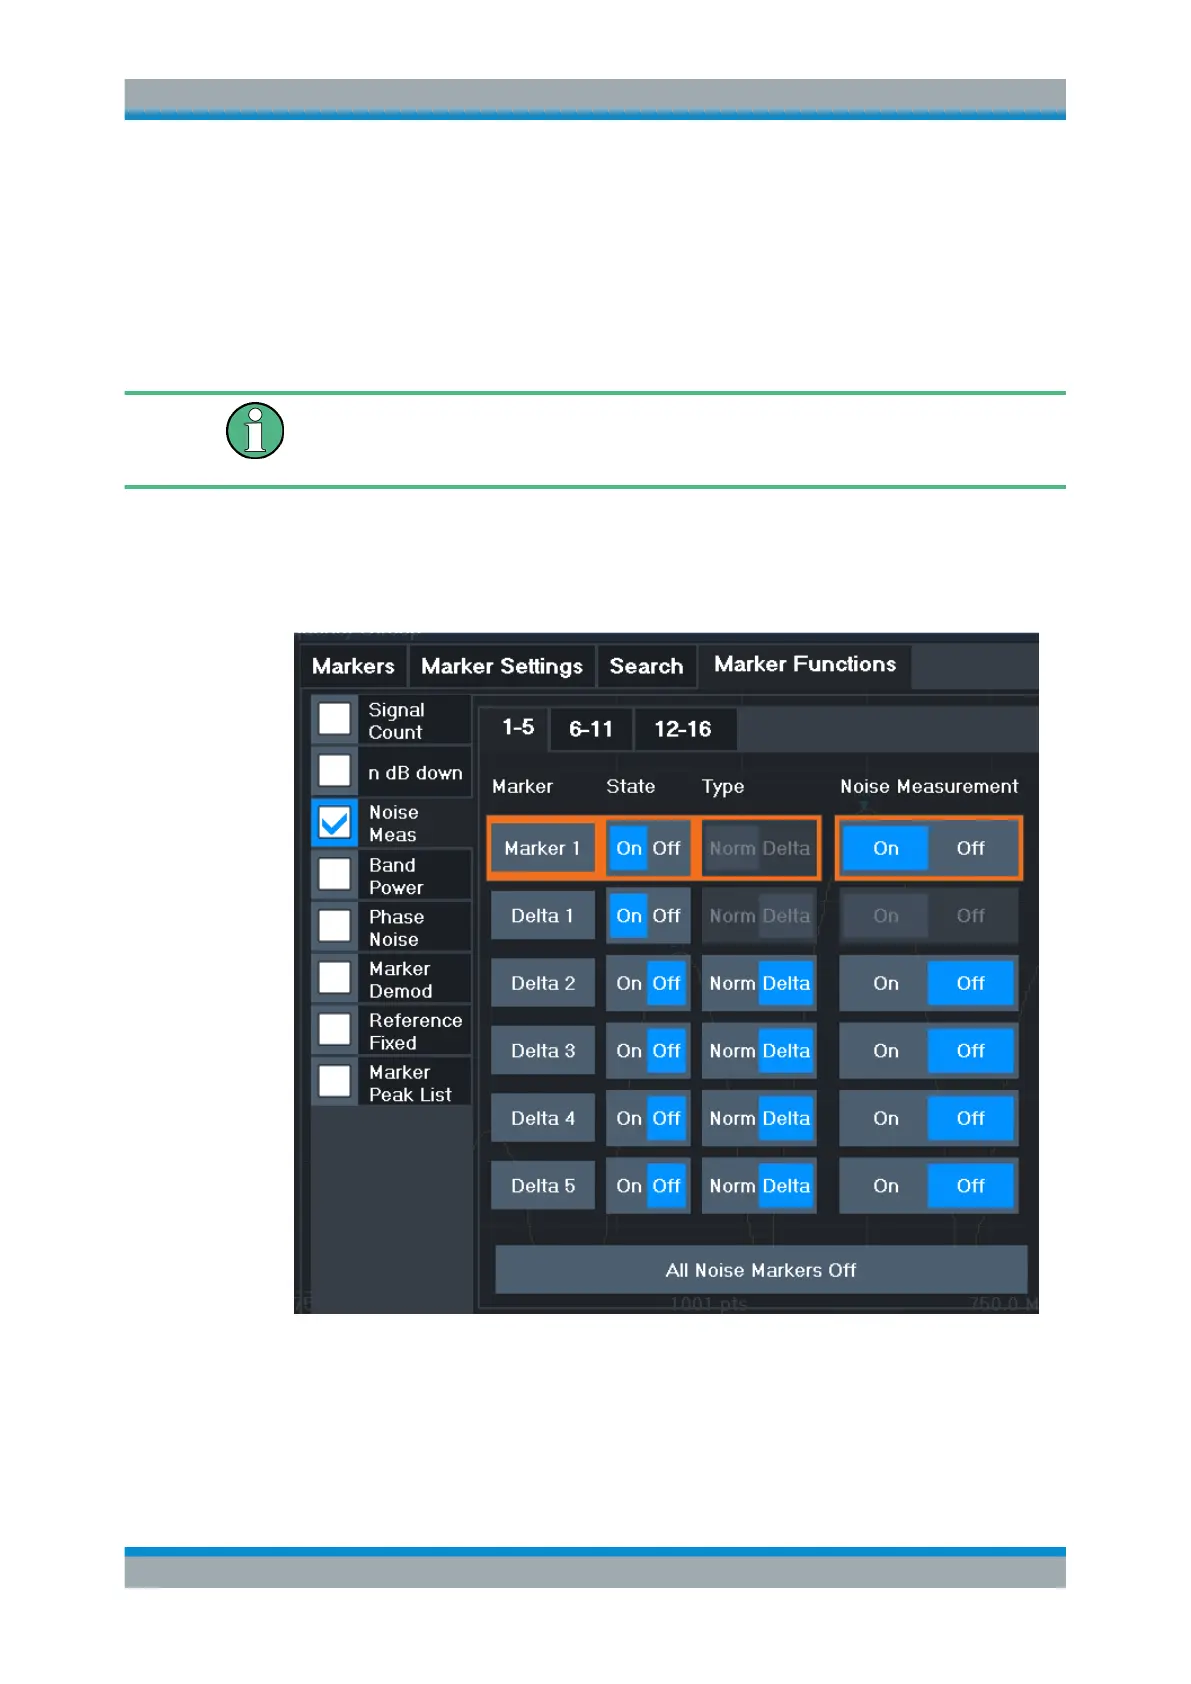
The individual marker settings correspond to those defined in the "Marker" dialog box
(see Chapter 9.3.2.1, "Individual Marker Setup", on page 519). Any settings to the
marker state or type changed in the "Marker Function" dialog box are also changed in
the "Marker" dialog box and vice versa.
Remote commands:
"Example: Measuring Noise Density" on page 1204
CALCulate<n>:MARKer<m>:FUNCtion:NOISe[:STATe] on page 1185
Marker Usage

 Loading...


