R&S
®
CMW 500 System Overview
Measurements
Operating Manual 1202.3986.32 – 03 42
settings are related to measurement statistics:
Statistics Type
Detectors
Peak Values
Averaging
Standard Deviation
3.2.4.1 Statistics Type
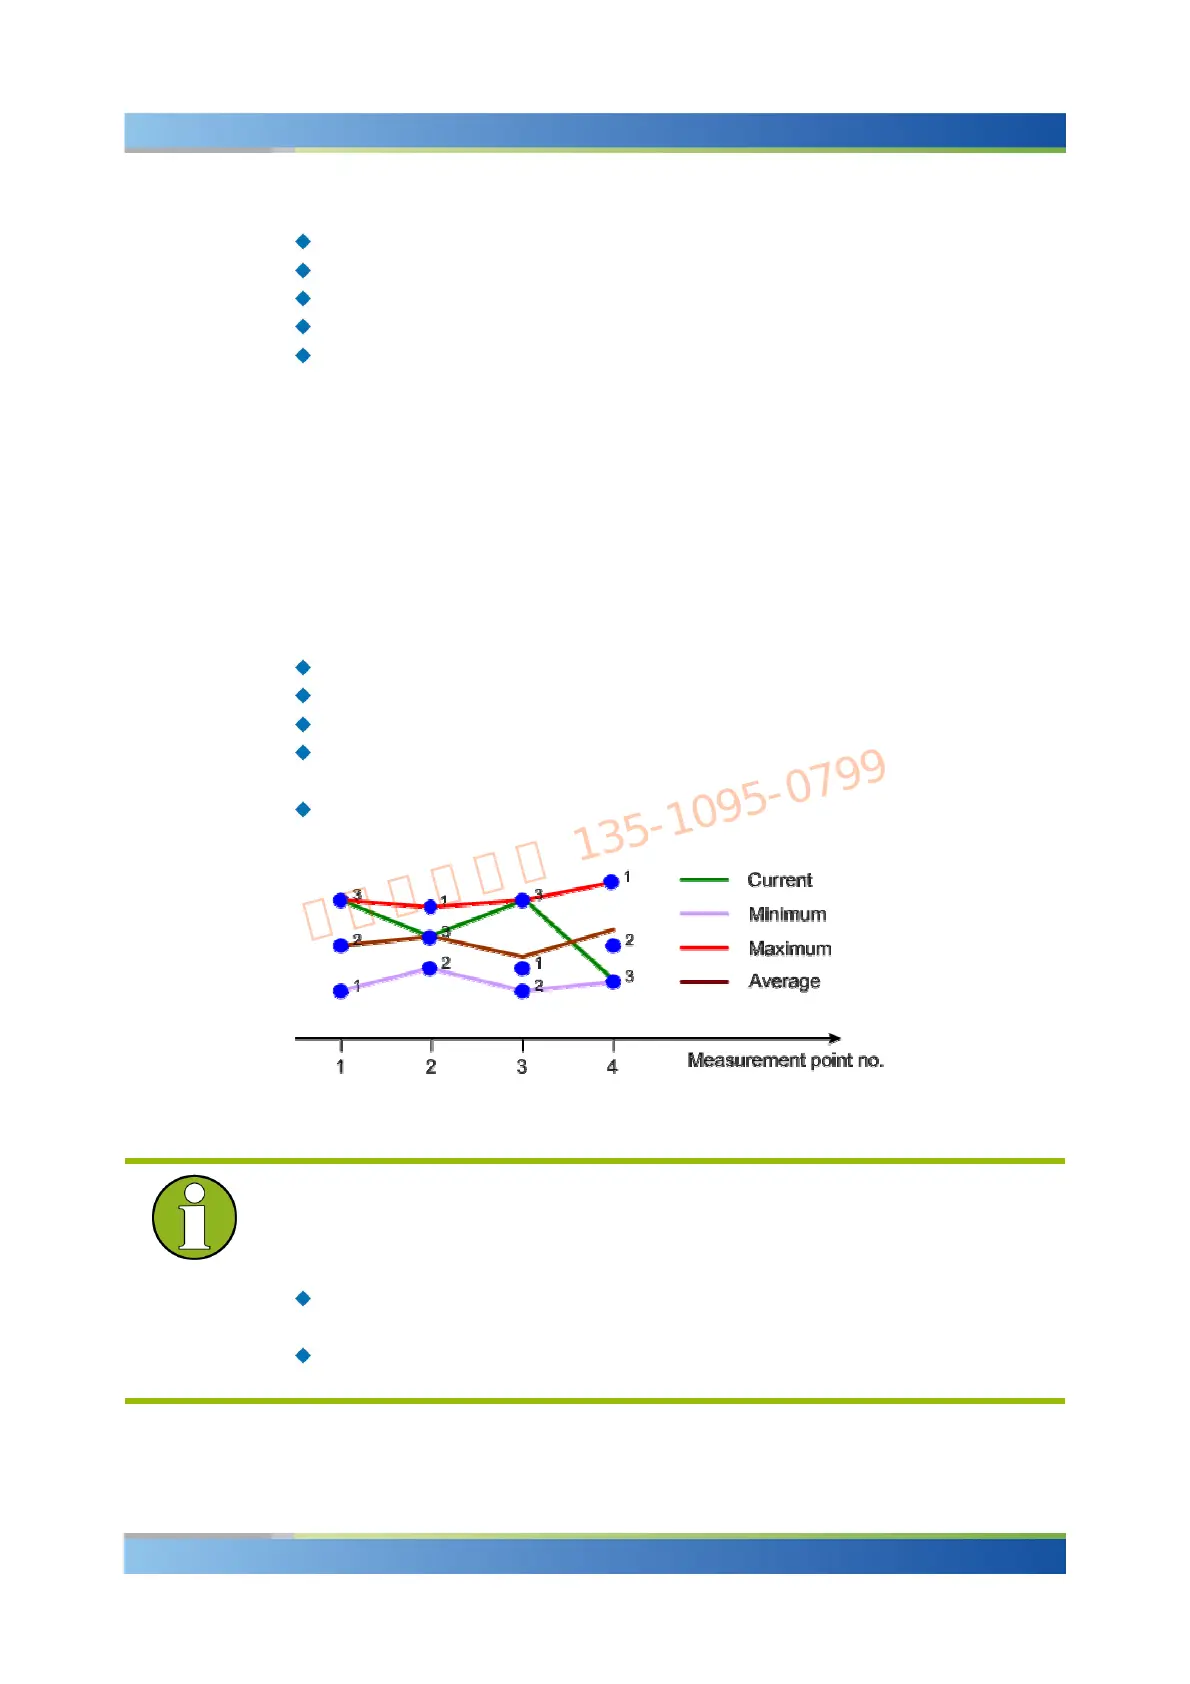
The statistics type defines how the R&S CMW 500 calculates the displayed values if
the measurement extends over several measurement intervals. Assume that a trace or
a bar graph contains a series of different measurement points. After n consecutive
measurement intervals, the instrument has collected n complete traces, corresponding
to n measurement results at each point. The different statistics types are calculated as
follows:
Current: The current trace, i.e. the last result at all measurement points
Minimum: The smallest of the n collected values at each measurement point
Maximum: The largest of the n collected values at each measurement point
Average: At each test point, a suitably defined average over all collected values is
displayed; see Averaging Procedures.
Standard Deviation: At each test point, the root mean square deviation of all
collected values from the "Average" value is displayed; see Standard Deviation.
Statistics Types
Differences between statistical calculations
Minimum/Maximum and Average results are calculated differently if the measurement
extends over more than one statistics cycle (repetition mode "Continuous",
measurement time longer than one statistics cycle):
The "Minimum" and "Maximum" values represent the smallest and largest values
ever measured.
The "Average" result is referenced to the last statistics cycle; see paragraph on
Averaging Procedures below.
The statistics type of the displayed trace generally belongs to the display configuration
 Loading...