392 Using the Scratchpad
As you graph multiple functions on the axes, the label containing the
expression displays for each. You can define and graph a maximum of
99 functions of each type.
4. Use the
b key to explore and analyze the graphed function by
tracing it, finding points of interest, or assigning a variable in the
expression to a slider.
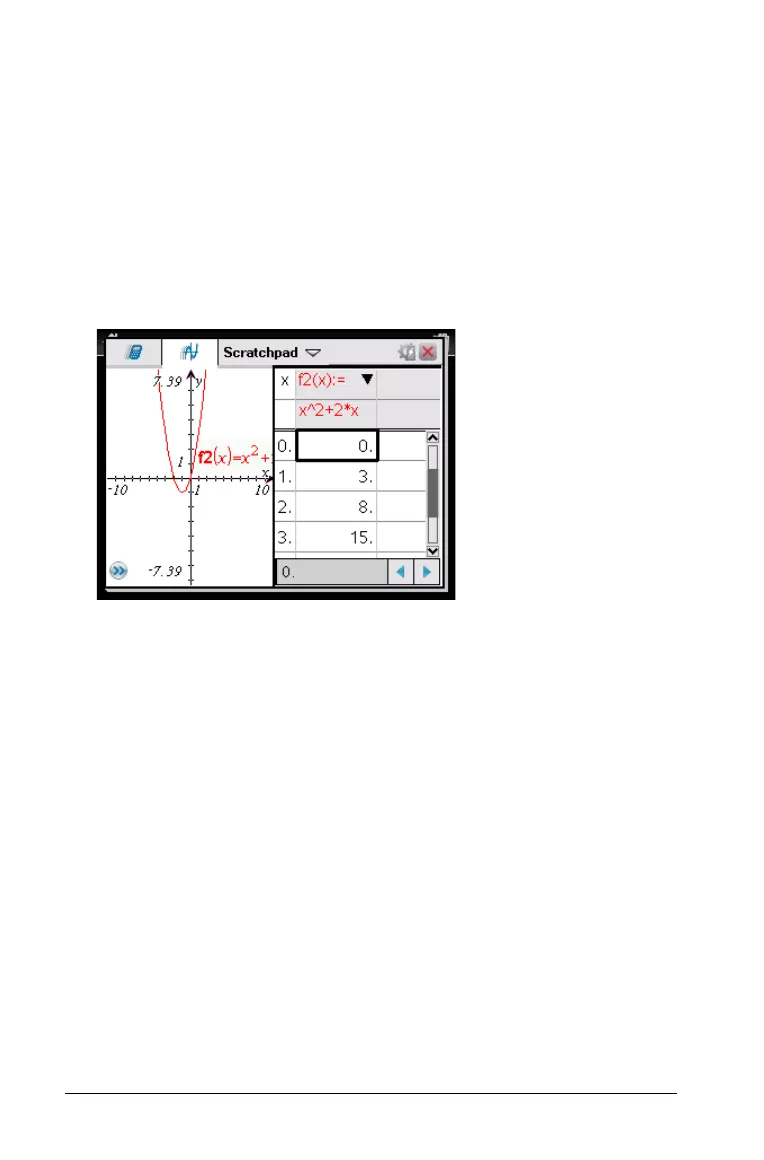
Viewing the function table
` To display a table of values for the current function, press
b25.
` To hide the function table, click the graph and then press
b25.
Changing the appearance of the axes
As you work with graphs, the Cartesian axes are displayed by default.
You can change the appearance of the axes in the following ways:
1. Press b4 and choose the Zoom tool to use.
2. Select the axes and press
/b3 to activate the Attributes
tool.
a) Press 9 or : to move to the attribute to change. For example,
choose the end style attribute.
b) Press 7 or 8 to choose the style to apply.
c) Change any other attributes of the axes as required for your work,
then press
d to exit the attributes tool.
3. Adjust the axes scale and tic mark spacing manually.