Graphs & Geometry 471
The work area and entry line change to function mode. Type an
expression for the function after the equal sign.
– To graph a parametric equation, select Parametric on the Graph
Type
menu.
Type expressions for xn(t) and yn(t). Specifying alternate values for
the default t-min, t-max, and t-step displayed is optional.
– To graph a polar equation, select
Polar on the Graph Type menu.
Type an expression for rn(q). Specifying alternate values for the
default q-minimum and q-maximum, and q-step displayed is
optional.
– To graph a scatter plot, select
Scatter Plot on the Graph Type
menu.
The work area and entry line change to scatter plot mode. Click
var to choose variable to plot as x and y for sn. You can also type
the name of a variable that already exists, or define a list as
comma-separated elements enclosed within brackets, for
example: {1,2,3}.
– Choose the option for the type of sequence you want to plot.
To plot a web plot or time plot of a sequence, select
Sequence on
the Graph Type menu and choose Sequence.
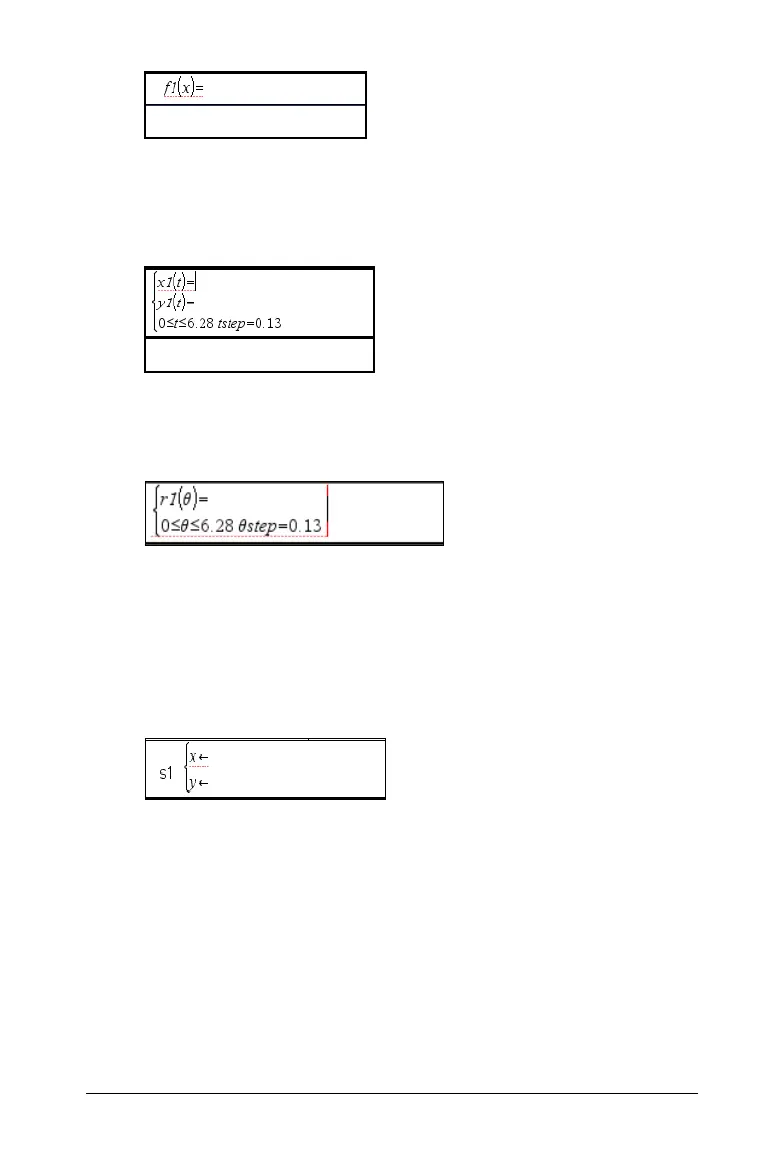
Function mode entry line
Parametric mode entry line
Polar mode entry line
Scatter Plot mode entry line
 Loading...


