484 Graphs & Geometry
Using the Text tool to enter functions
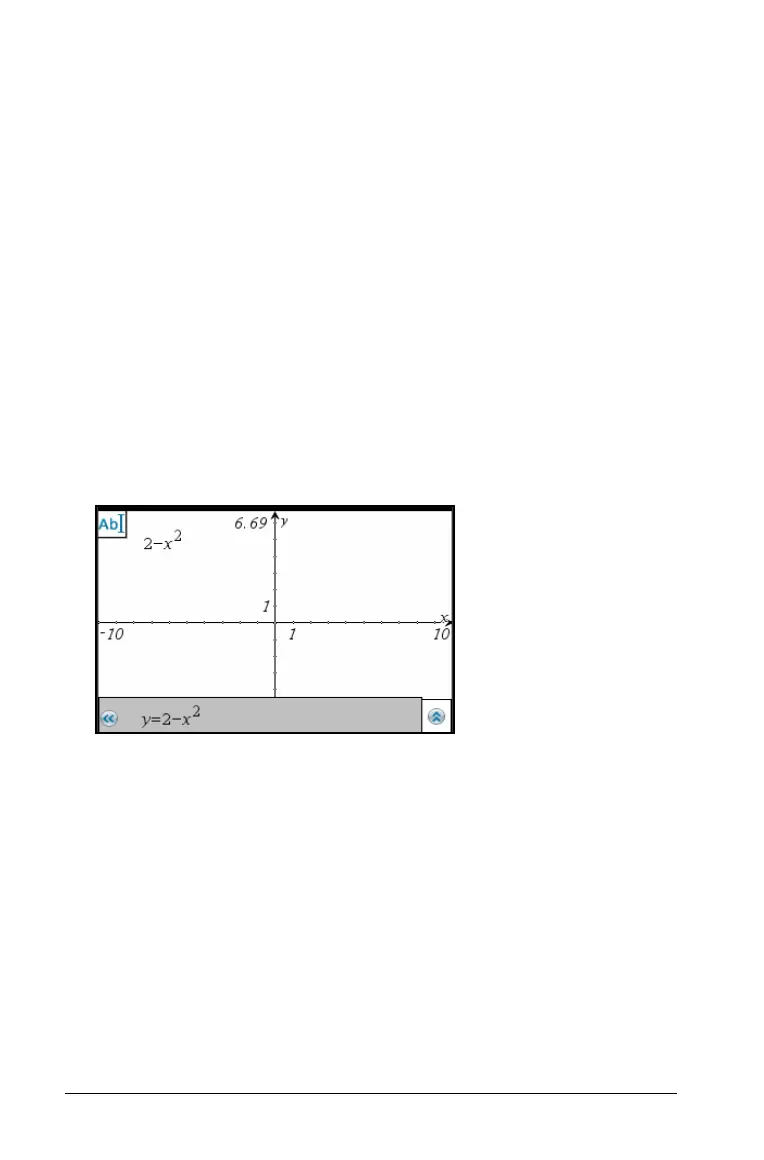
You can graph a function, including a function of the form “y=”, by
typing the expression into a text box. To graph a function this way:
1. From the
Actions menu, select Tex t :
2. Click the work area to place the text box. Type the function you want
to graph.
3. Drag the text box to the axis and drop it.
Graphs & Geometry graphs the function.
Field Resolution
Sets the number of columns of field rendering
elements (line segments) used to draw a slope
or direction field. You can change this
parameter only if
Field = Direction or Slope.
Direction Field at x=
Sets the independent variable value at which
a direction field is drawn when plotting non-
autonomous equations (those that refer to x).
Ignored when plotting autonomous
equations. You can change this parameter
only if
Field = Direction.

 Loading...


