604 Using Data & Statistics
Note: If two variables are plotted in the work area, you can create a
dot plot by removing one variable. Choose Remove X Variable or
Remove Y Variable from the Plot Types menu.
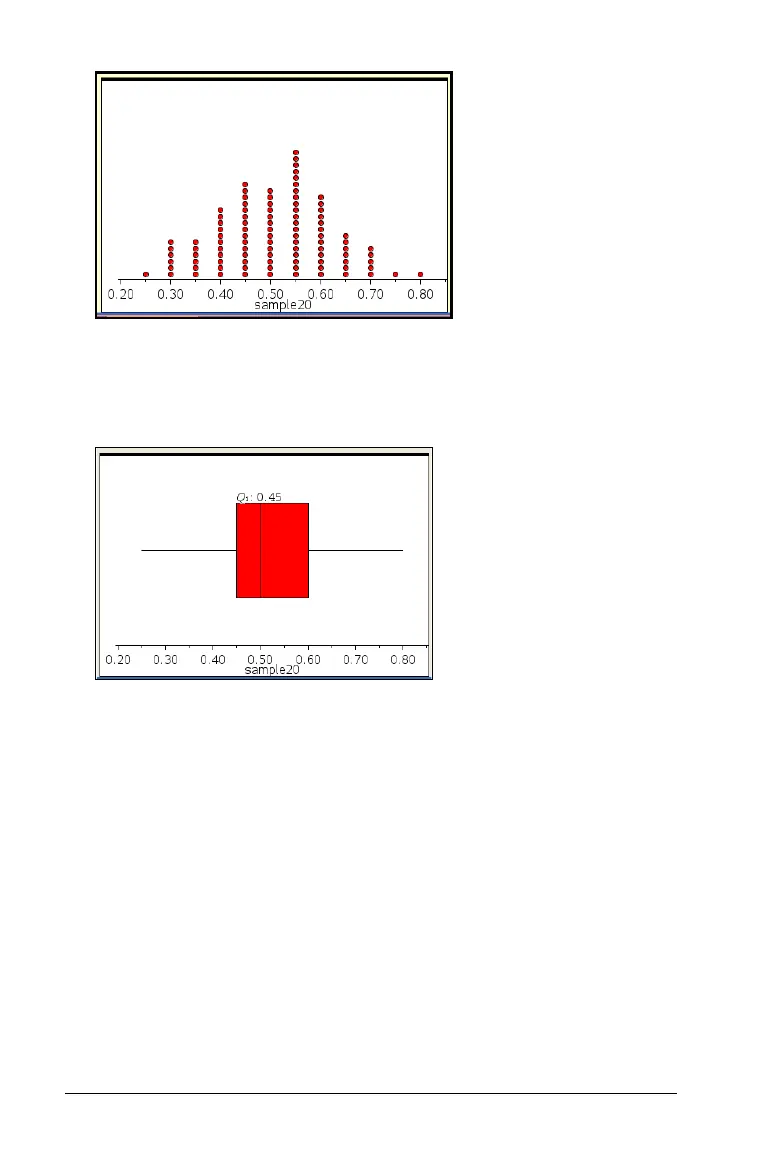
2. On the
Plot Types menu, select Box Plot.
A modified box plot displays on the Data & Statistics work area.
Note: You can split a box plot by category by adding a list that
contains corresponding categorical data to the y-axis.
3. (Optional) To add additional variables for comparing box plots on the
same axis, click
Add X Variable on the Plot Properties menu.
 Loading...


