Using Data & Statistics 605
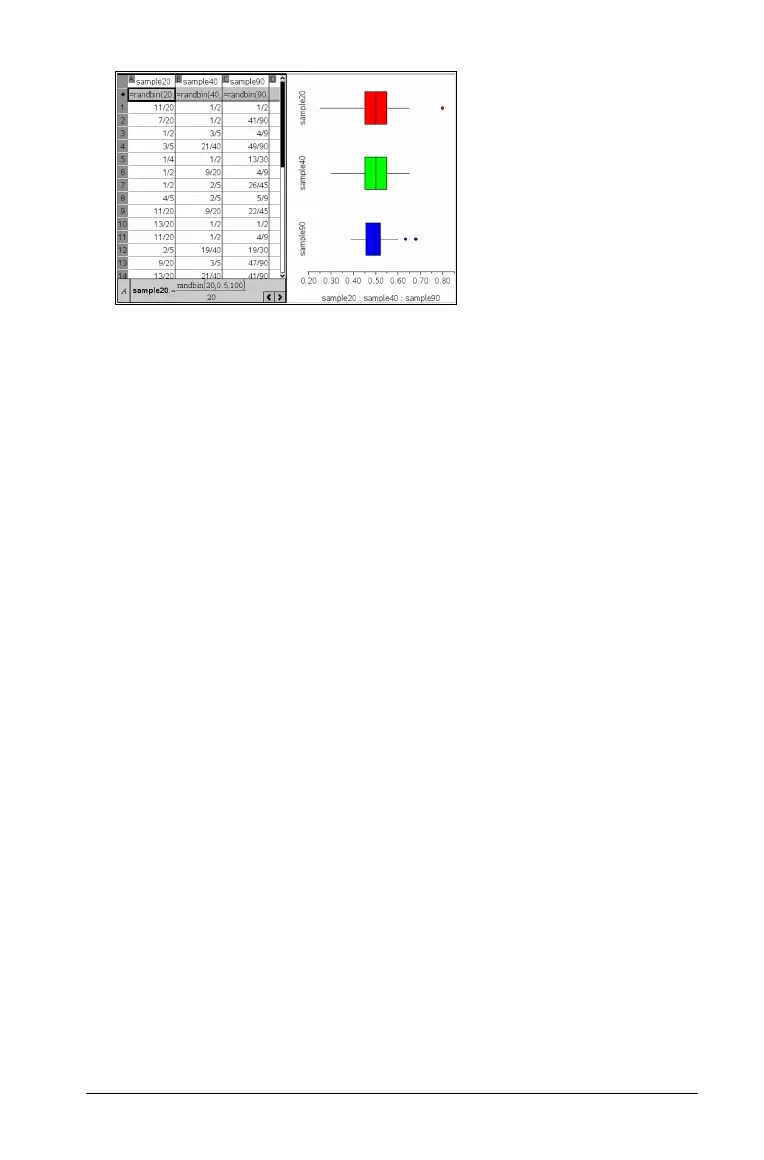
For example, you can use multiple boxplots to compare the
distributions of sample proportions. In the example, true proportion
is .5 and sample size varies from n=20 to n=40 to n=90.
Notes:
– You can create a box plot with frequency by choosing Add X
Variable
or Add Y Variable on the Plot Properties menu.
– You can specify a variable multiple times as you choose variables
to plot as box plots.
– The variable used to provide frequency information is added to
the label on the horizontal axis in the format:
x_variablename{frequencylist_name}
.
4. Point and click the regions of the box plot to explore and analyze the
data it represents.
– Hover over a region or over a whisker to display the details for the
portion of the plot that interests you. The label for the quartile
that corresponds to your selection displays.
– Click a region of the box plot to select the data points or whiskers.
Click again to remove the selection.
– You can select any box plot that does not include frequency data
and choose
Dot Plot on the context menu to change the plot
type.
– Drag a selection to move it and explore other possibilities for the
data.
– Use the arrow keys to move a data point one pixel at a time.
– Activate the Graph Trace tool and press 7 or 8 to move across dots
and regions of the plot. As the trace cursor moves, the values for
Q1, the median, Q3, and whisker ends/outliers display.
5. Change the plot from a modified box plot to a standard box plot by
choosing Extend Box Plot Whiskers on the Plot Properties menu.
 Loading...


