Using Data & Statistics 607
3. Explore the data in the bins of the histogram.
– Hover over a bin to see the information for that bin.
– Adjust the width and number by dragging the side of a bin.
– Click a bin to select it. Click the bin again to deselect it.
– Drag a selection to move it.
Note: The bars are not movable in categorical plots.
– Activate the Graph Trace tool and press 7 or 8 tto move across the
bins and display values.
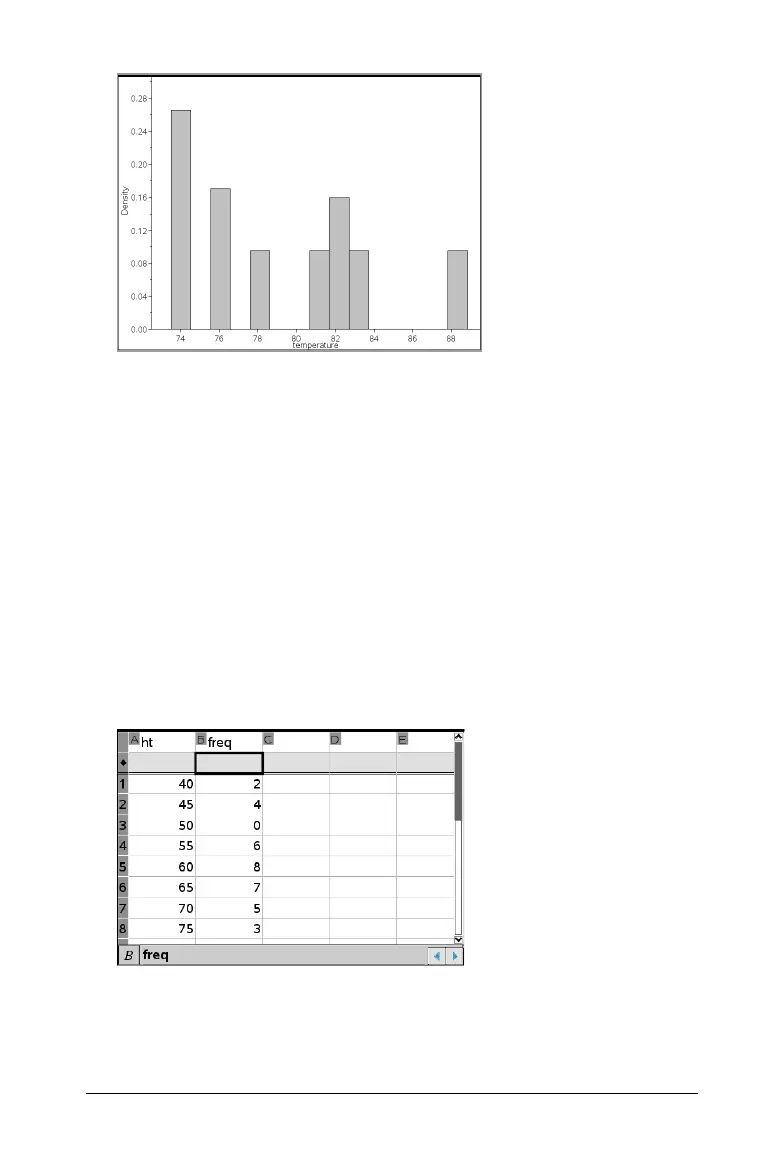
Creating a histogram with frequency or summary data
1. On a Lists & Spreadsheet page, create two lists: one containing the
“bins,” such as heights in a population (ht), and the other containing
the frequencies of those heights (freq).
2. On a Data & Statistics page, access the context menu on the x axis,
and select Add X Variable with Summary List.
3. Select ht as the X List and freq as the Summary List.
 Loading...


