612 Using Data & Statistics
Note: To type a string in Lists & Spreadsheet, enclose the characters in
quotes.
2. Add a Data & Statistics page to the problem.
Notes:
– You can also use the Lists & Spreadsheet Quick Graph tool to
automatically add a Data & Statistics page and plot the selected
column.
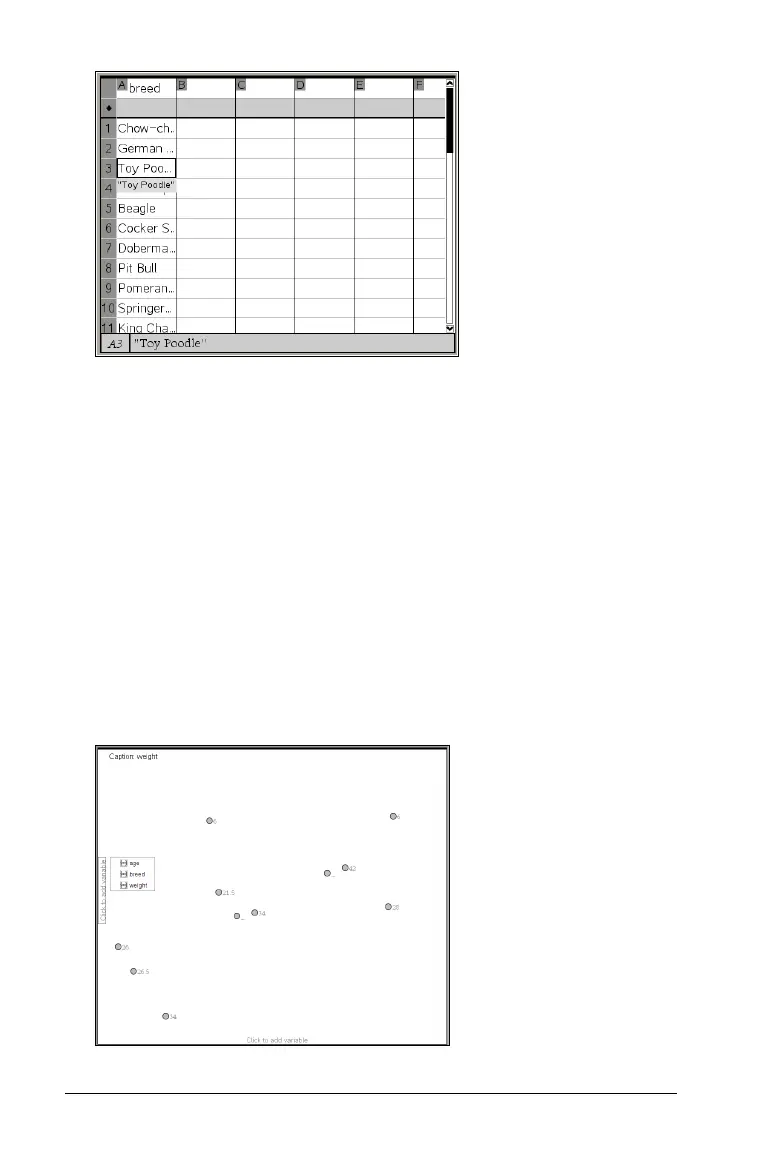
– The new Data & Statistic work area displays a default case plot
with a caption, variable name, and unplotted data points for the
variable. You can click the variable name in the caption to choose
another variable for previewing, or drag a default data point
toward an axis to plot the current variable.
3. Move near the center of either axis and click the Add List region. The
list of variables displays.

 Loading...


