Using Data & Statistics 641
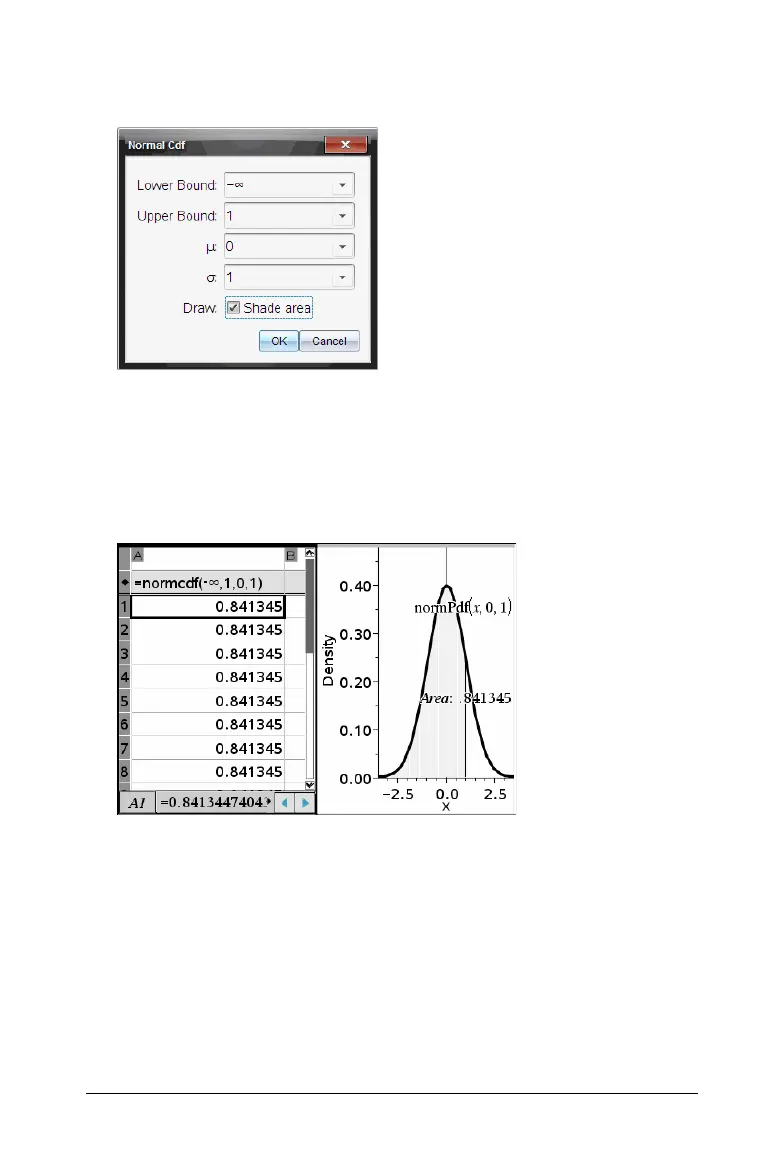
2. From the Statistics menu, select Distributions, and select
Normal Cdf.
3. Enter the plot parameters into the Normal Cdf wizard.
4. Click the Draw check box to see the distribution plotted and shaded
in Data & Statistics.
Note: The Draw option is not available for all distributions.
5. Select
OK.

 Loading...


