642 Using Data & Statistics
Exploring inferential statistics plots
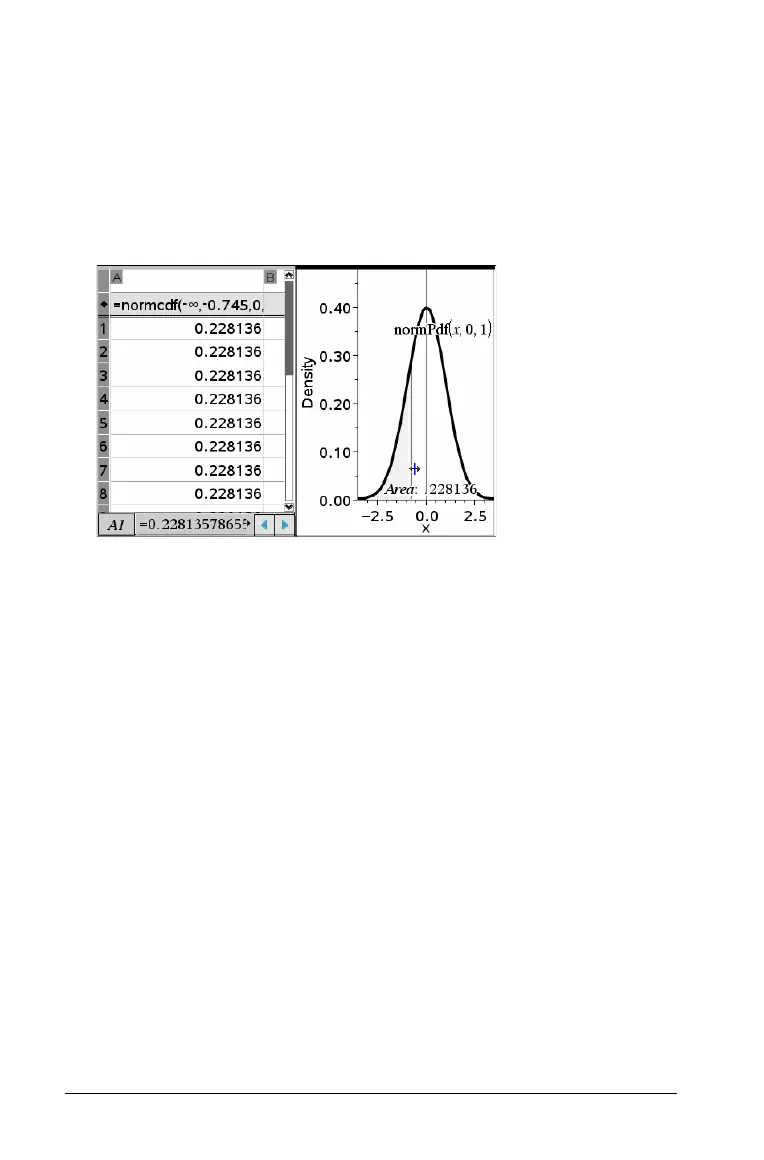
After drawing the plot in the previous example, you can explore the
effect of changing the upper bound.
` On the Data & Statistics plot, drag the vertical line that represents the
upper bound toward the left or right.
As you drag, the formula is updated and the shaded area is
recalculated.

 Loading...


