730 Data Collection and Analysis
Examine Settings
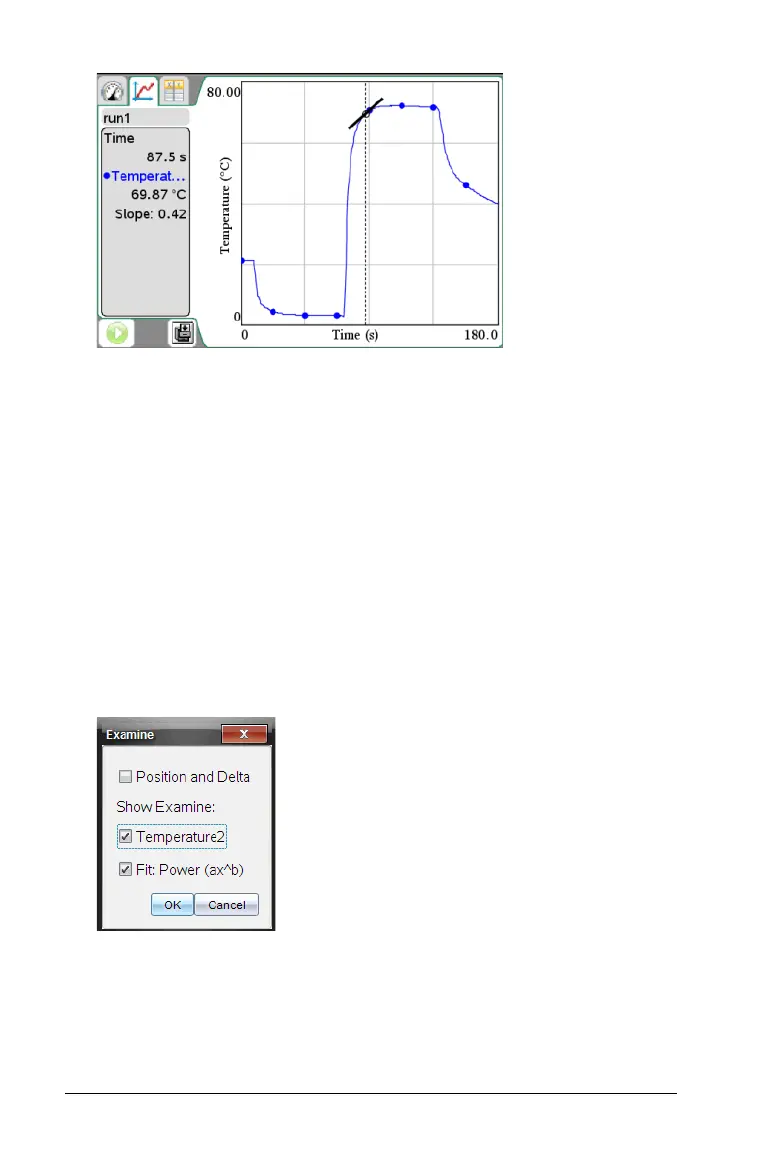
This option allows you to select which of the plotted columns and curve
fit you would like to trace when examining the data. Values are
displayed in the View details area and in the All Details for Graph dialog
box.
You can also show cursor position and delta values as you examine the
data by selecting the Position and Delta option. The values are displayed
below the graph.
To examine settings:
1. Select
Analyze > Examine Settings.
The Examine dialog box opens. The default is to have all “Show
Examine” items selected. In this example, there is one sensor column
and a curve fit with both selected.
 Loading...


