Data Collection and Analysis 737
5. Click OK.
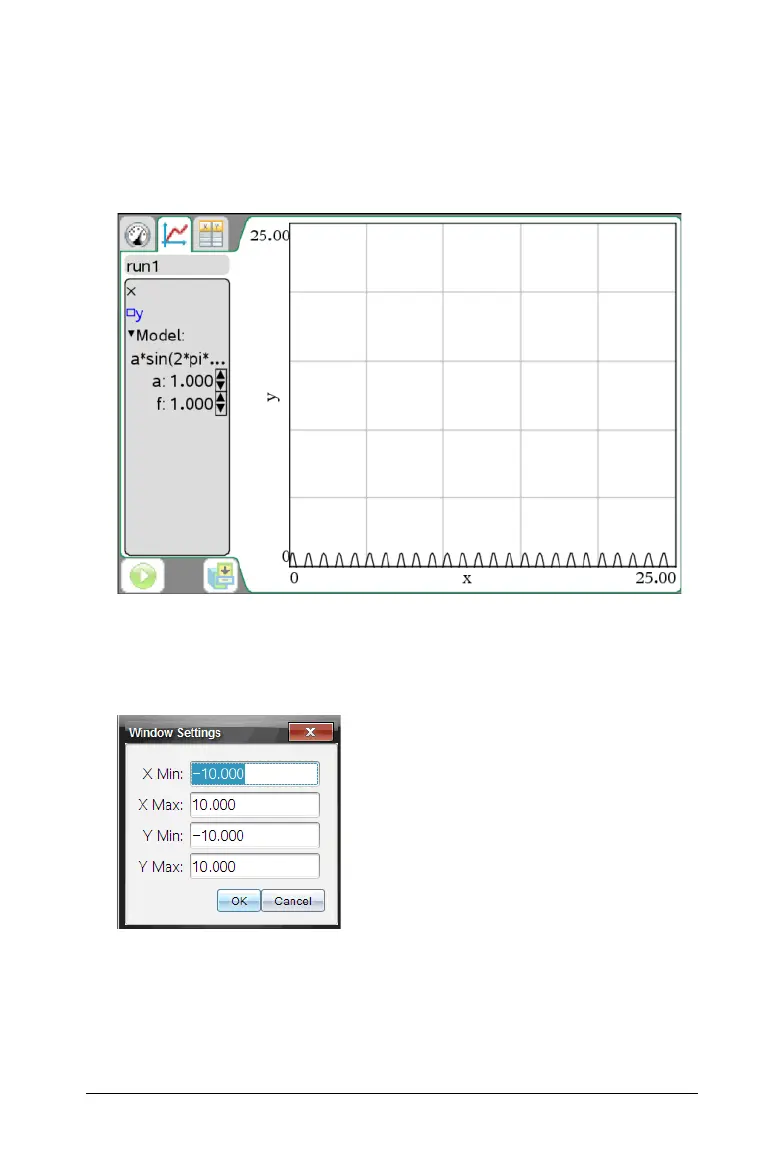
The model is shown on the graph with adjustment options in the
View Details area and in the All Details for Graph dialog box.
Notice that the screen’s minimum and maximum axis are too large for
this particular example.
6. (Optional) Adjust the window setting for minimum and maximum
axis by clicking on the y and x minimum and maximum values directly
on the screen to change, or select Graph > Window Settings. Click
OK when done. See Setting Min and Max axis ranges.

 Loading...


