Data Collection and Analysis 745
1. Select View > Graph or click .
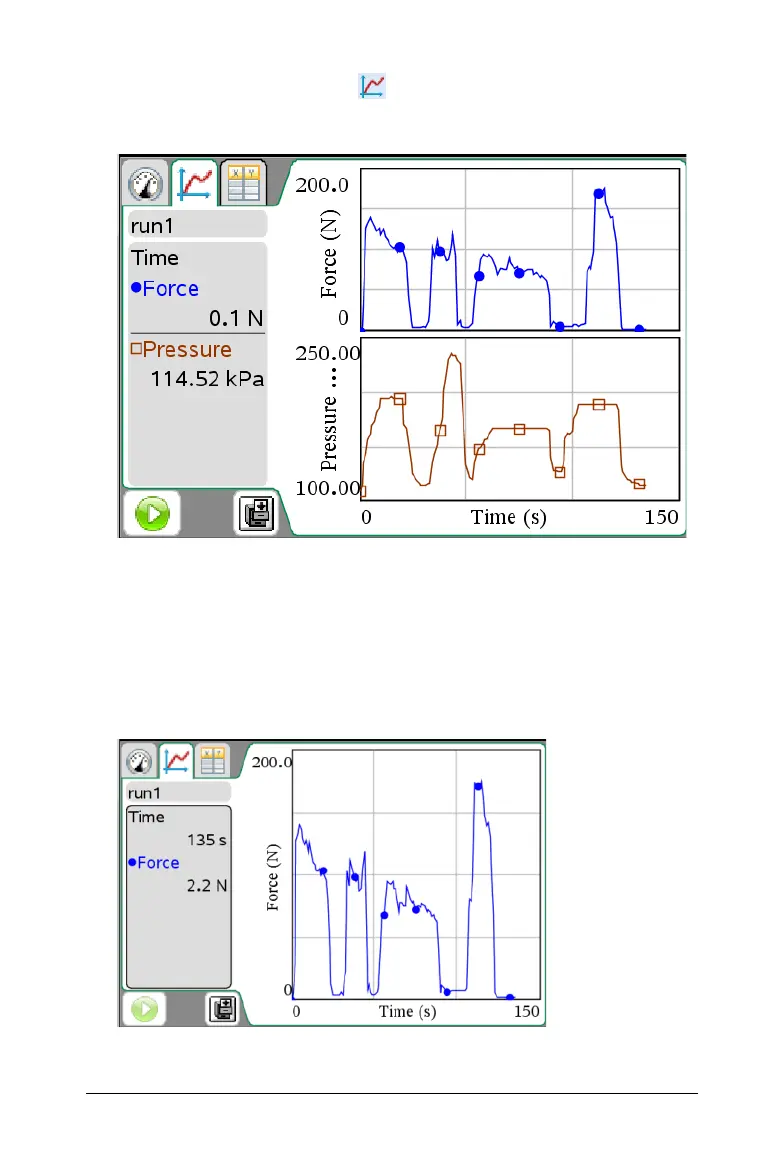
In this example, both graphs are shown by default.
Showing Graph 1
Continuing with the same example as Showing Graphs, this process
shows how to display only Graph 1.
³ Select
Graph > Show Graph > Graph 1.
Only Graph 1 is displayed. Graph 1 is the top graph when both graphs
are displayed.
 Loading...


