746 Data Collection and Analysis
Showing Graph 2
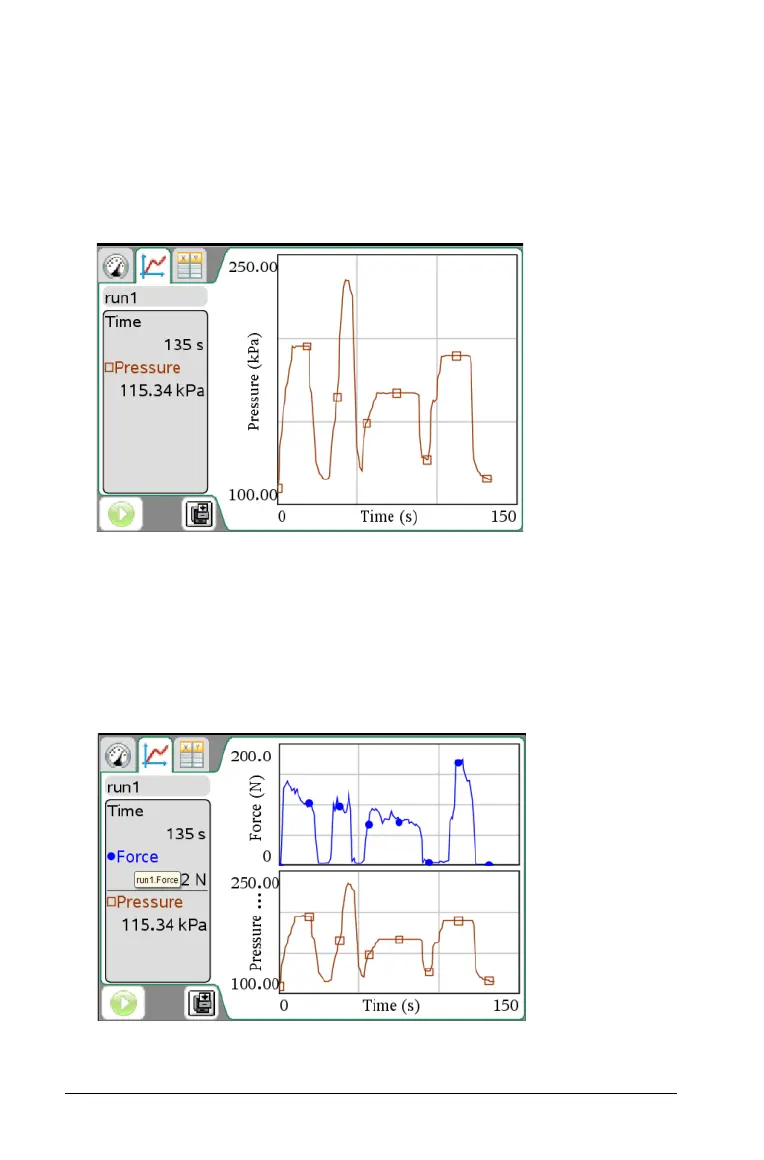
Continuing with the same example as Showing Graphs, this process
shows how to display only Graph 2.
³ Select
Graph > Show Graph > Graph 2.
Only Graph 2 is displayed. Graph 2 is the bottom graph when both
graphs are displayed.
Showing both graphs
Continuing with the same example as Showing Graphs, this process
shows how to display both graphs if you have previously selected to
show only Graph 1 or Graph 2.
³ Select
Graph > Show Graph > Both.
Both graphs are displayed.
 Loading...


