USING THE ETHERNET PORT
. . . .. . . ... .... .... .... ..... ..
Sievers TOC-R3 Operation and Maintenance Manual
DLM 95000-01 EN Rev. A 108 © Veolia 2023
DASHBOARD SCREEN
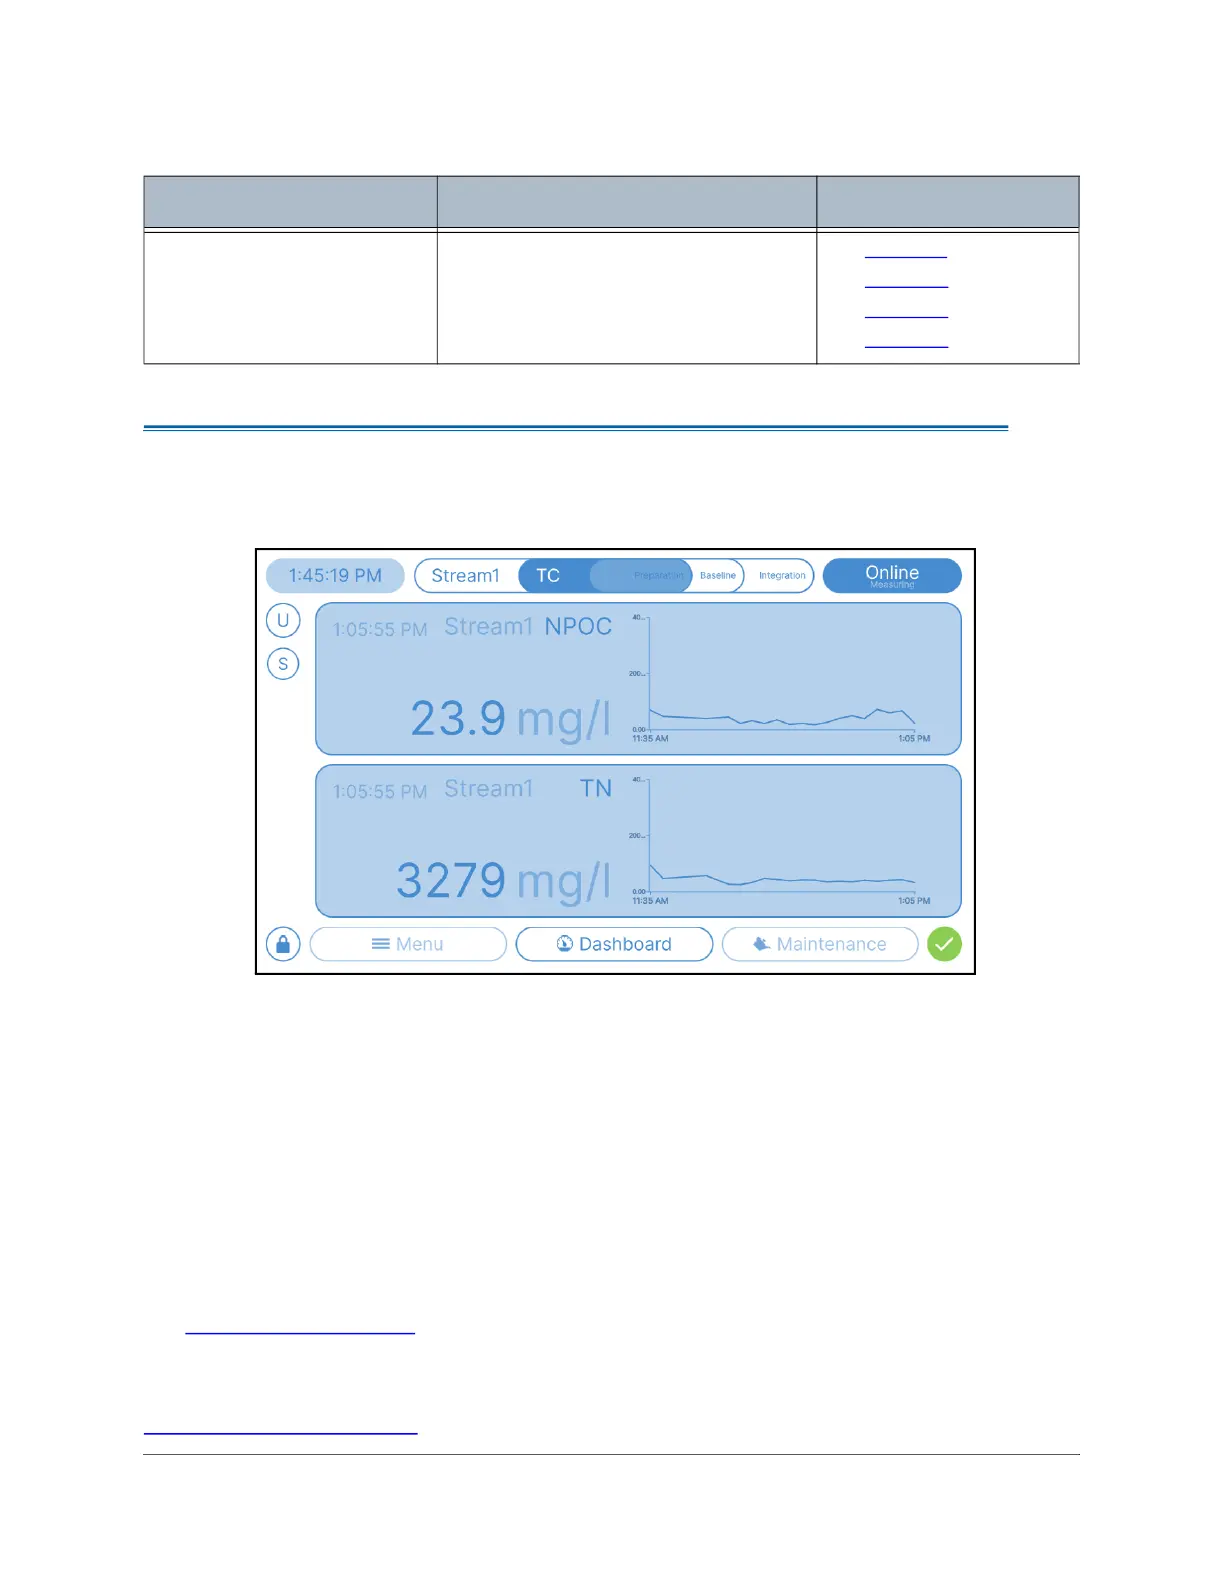
Figure 4-8: Dashboard Screen (Online View Example)
The Dashboard screen is the primary view of the Analyzer while it is performing analysis.
The Dashboard screen displays information about the current measurement cycle. The
Dashboard screen will appear differently depending on whether the Analyzer is in Online or
Offline Operating Mode. The Operating Mode can be changed by pressing the Operating Mode
button in the top right corner to display either “Online” or “Offline”.
Use the Dashboard screen to view the current measurement settings, Streams, results, and
status. This view can be highly customized to display multiple Dashboards (up to six) of different
information (for Online analysis only). If more than three Dashboard parameters are selected, the
trend graph view will not display. For more information on customizing the Dashboard screen,
see “Software” on page 160
.
If the Analyzer is performing Online analysis, the Dashboard screen will display any User
customized “Dashboards” and the current measurement cycle status. For more information, see
“Online Mode” on page 168.
Menu • Settings
• Service
• Archive
• General
• page 118
• page 132
• page 148
• page 155
Table 4-3: Main Screens (Continued)
Name Function/Screen Information
 Loading...