MEASUREMENT HISTORY
. . . .. . . ... .... .... .... ..... ..
Sievers TOC-R3 Operation and Maintenance Manual
DLM 95000-01 EN Rev. A 152 © Veolia 2023
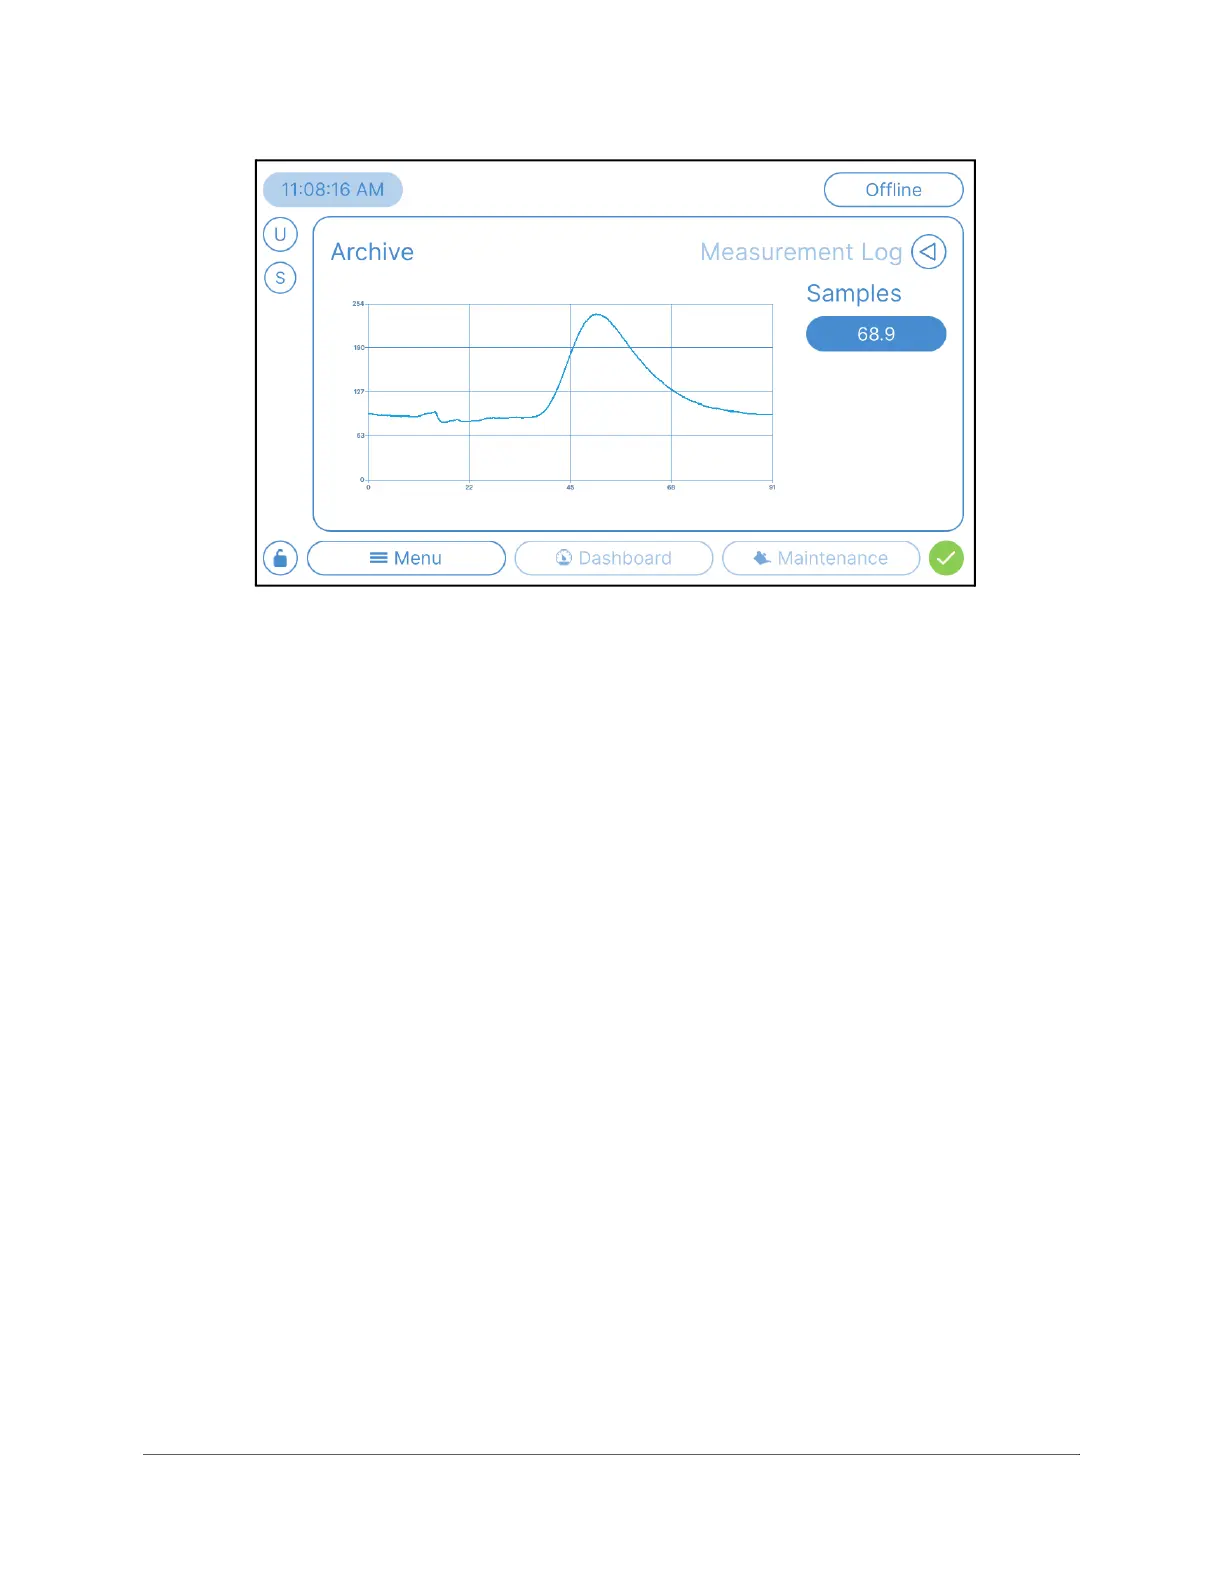
Figure 4-46: Menu → Archive → Measurement Log → Details
Measurement History
The Measurement History screen displays a trend graph of analysis results. The graph
parameters are adjustable.
Select D
AY to display the results from a single day. Use the “Method Button” to change
the Method that is being displayed.
Select C
HECK to display the results of the Check Function, if used.
The S
ELECTED DATE button allows for the selection of a single day of results.
Select T
IMELINE to add “From” and “To” date filtering to allow for selecting time periods
longer than one day.
 Loading...