CALIBRATION LOG
. . . .. . . ... .... .... .... ..... ..
Sievers TOC-R3 Operation and Maintenance Manual
DLM 95000-01 EN Rev. A 154 © Veolia 2023
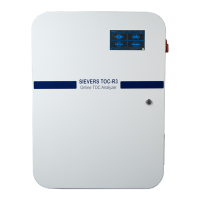
Figure 4-48: Menu → Archive → Calibration Log
Calibration Log Details Screen:
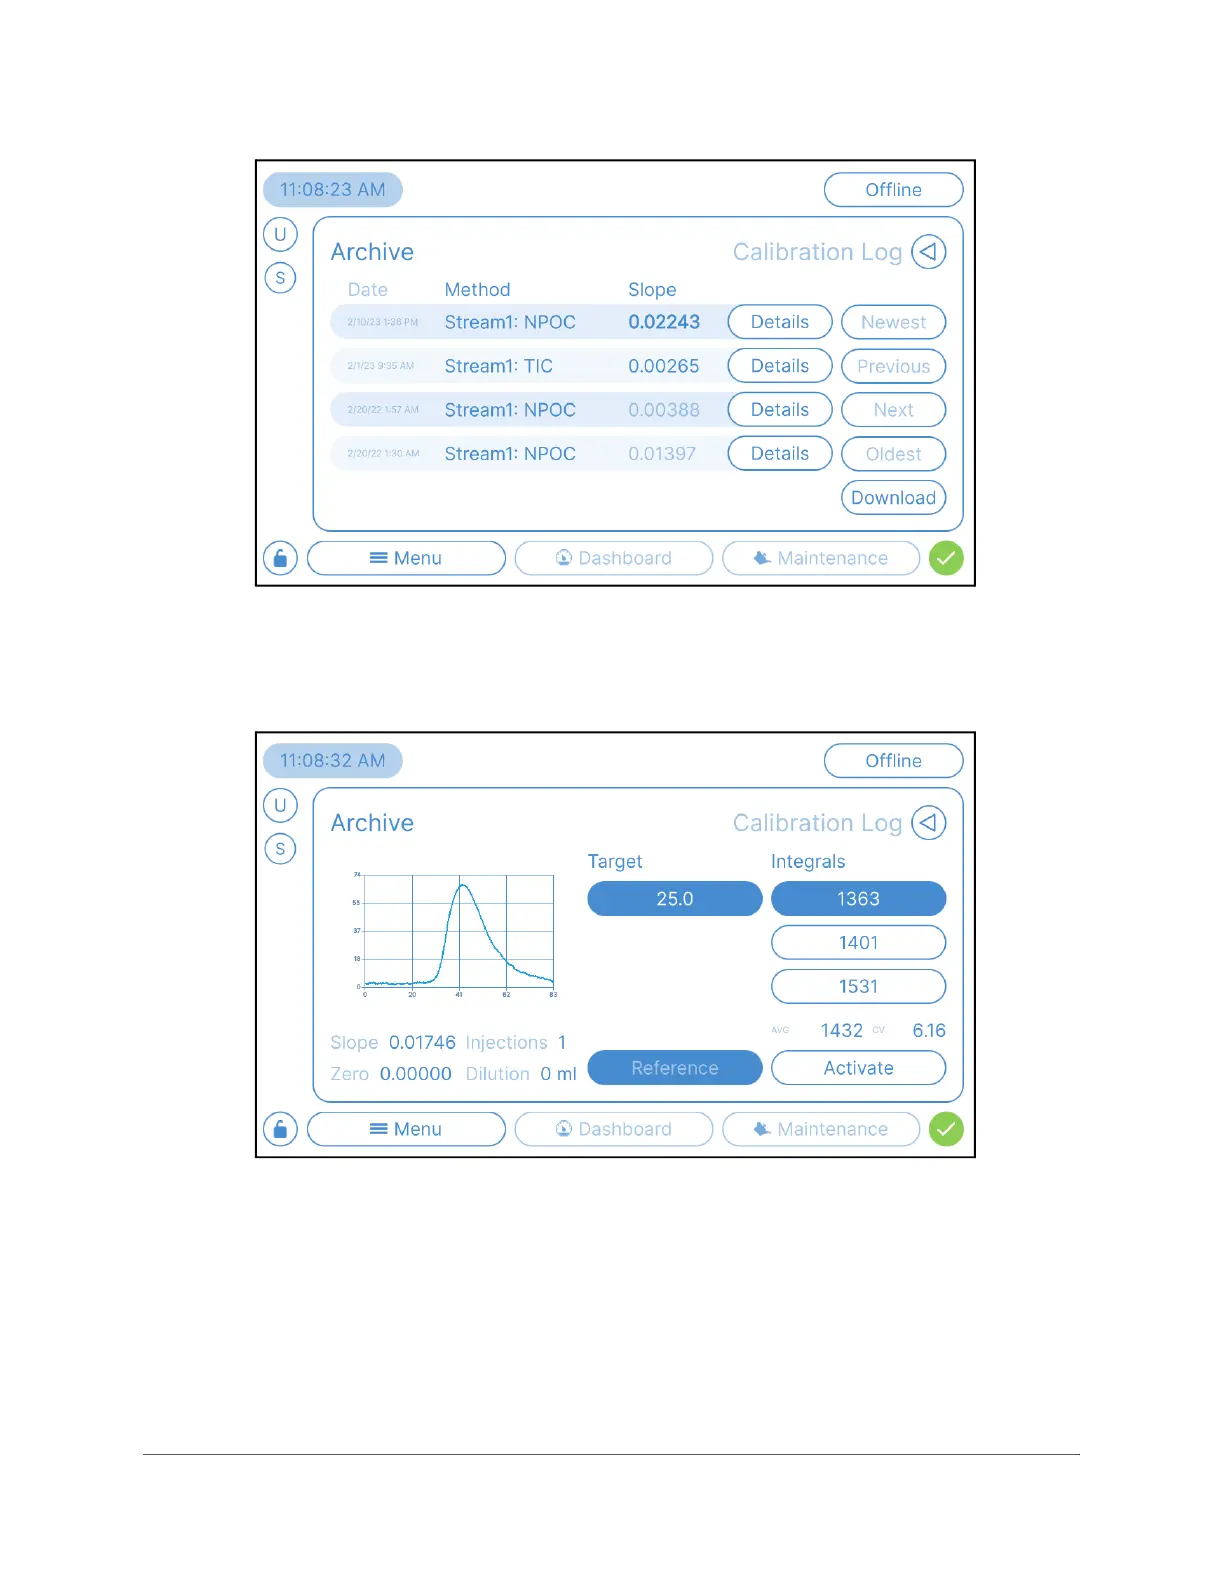
Figure 4-49: Menu → Archive → Calibration Log → Details
• Target — The expected concentration.
• Average (of Peak Area) — The Average of the accepted Integrals that were not
rejected.
• %CV (Coefficient of Variation) — This represents the reproducibility of the
accepted Repetitions. This is the %RSD (Relative Standard Deviation).
• Integrals — The peak area/integral values for each Repetition of the Calibration.
 Loading...