BASIC ANALYZER OPERATION
Chapter 4
............
Sievers TOC-R3 Operation and Maintenance Manual
DLM 95000-01 EN Rev. A 135 © Veolia 2023
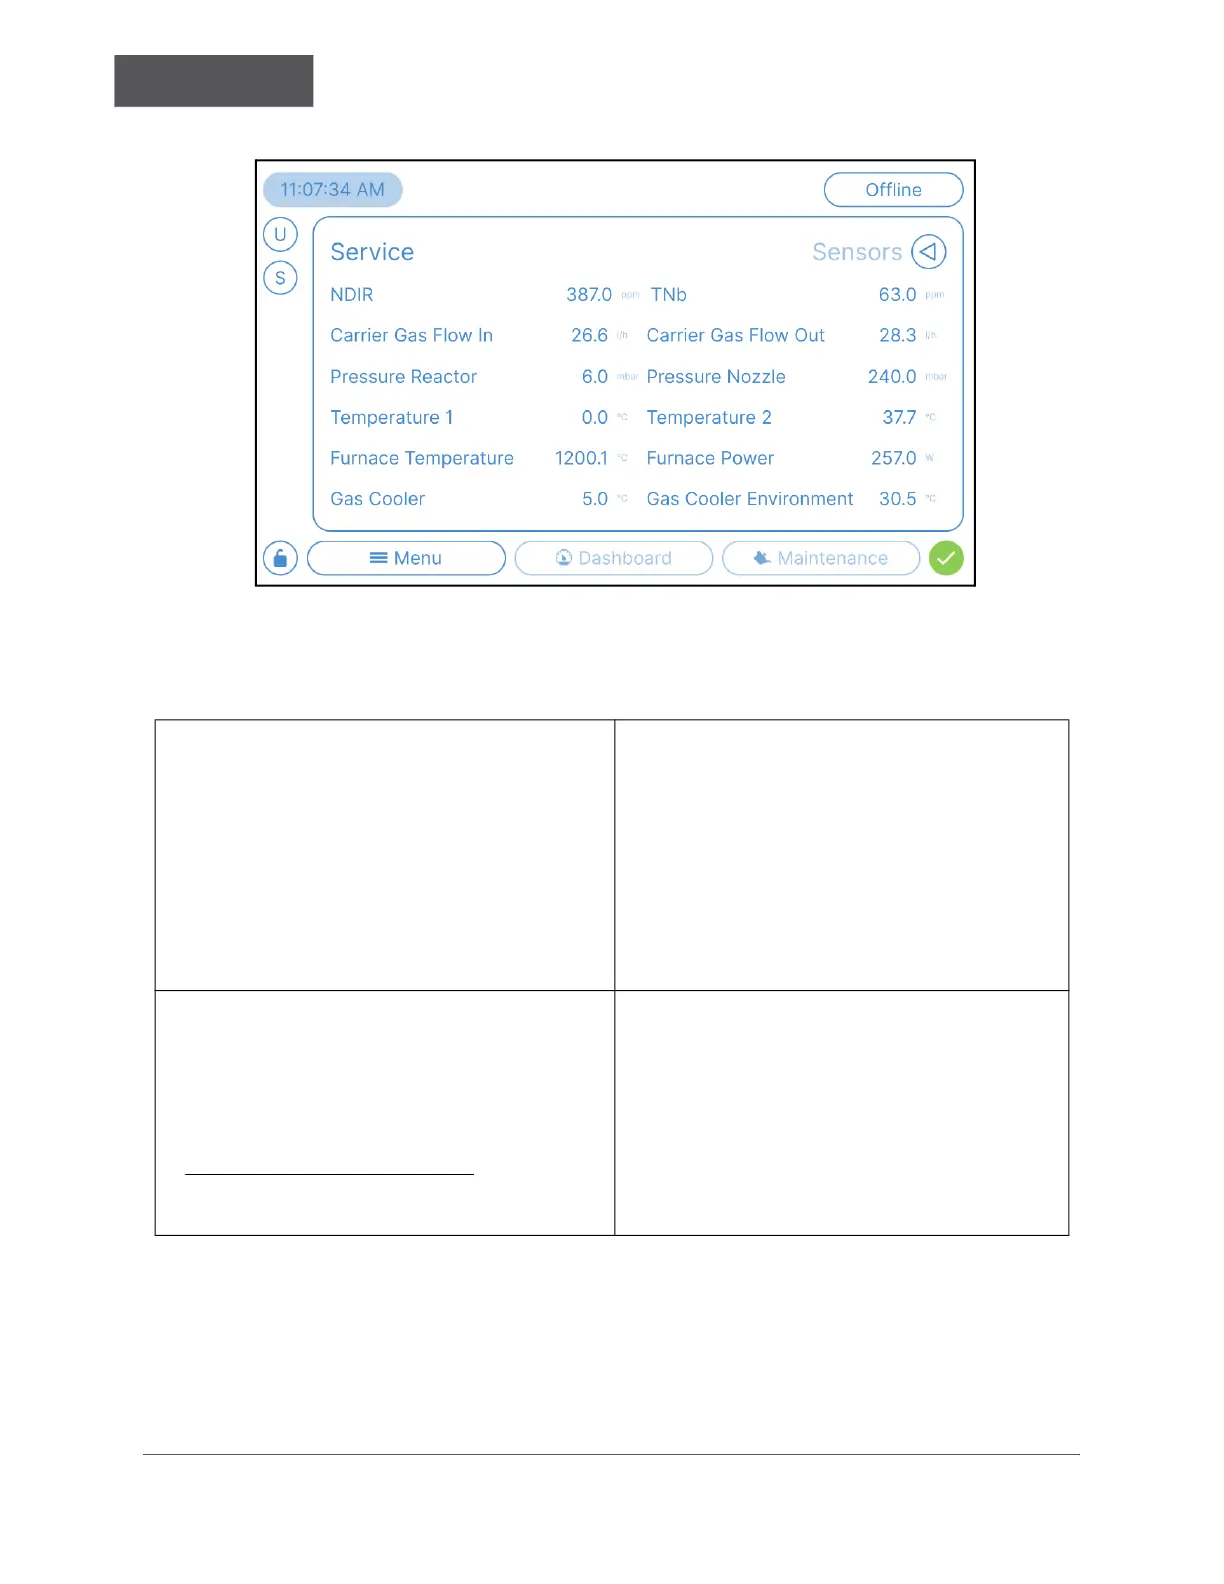
Figure 4-32: Menu → Service → Sensors
Table 4-5: Sensor Details and Normal Readings
NDIR — displays a live view of CO
2
concentration flowing through the NDIR Detector
in ppm.
This number represents the NDIR Detector
baseline.
TNb
a
— displays a live view of NO concentration
flowing through the ECD Detector in ppm.
This number represents the ECD Detector
baseline.
PID
b
— displays a live view of POC/VOC
concentration detected in the PID Detector in
ppm.
This number represents the PID Detector
baseline.
Carrier Gas Flow In* — (BF1 Sensor) Displays
the current gas flow entering the Analyzer in liters
per hour.
A normal reading for the “Carrier Gas Flow In” is
between 20-30 l/h. This is set by the external air
regulator.
*Important! Carrier Gas Flow In
adjustments will impact Calibration.
Carrier Gas Flow Out — (BF2 Sensor) Displays
the current gas flow exiting the Analyzer in liters
per hour.
A normal reading should display ± 2-5 l/h to
“Carrier Gas Flow In” value.
 Loading...