BASIC ANALYZER OPERATION
Chapter 4
............
Sievers TOC-R3 Operation and Maintenance Manual
DLM 95000-01 EN Rev. A 133 © Veolia 2023
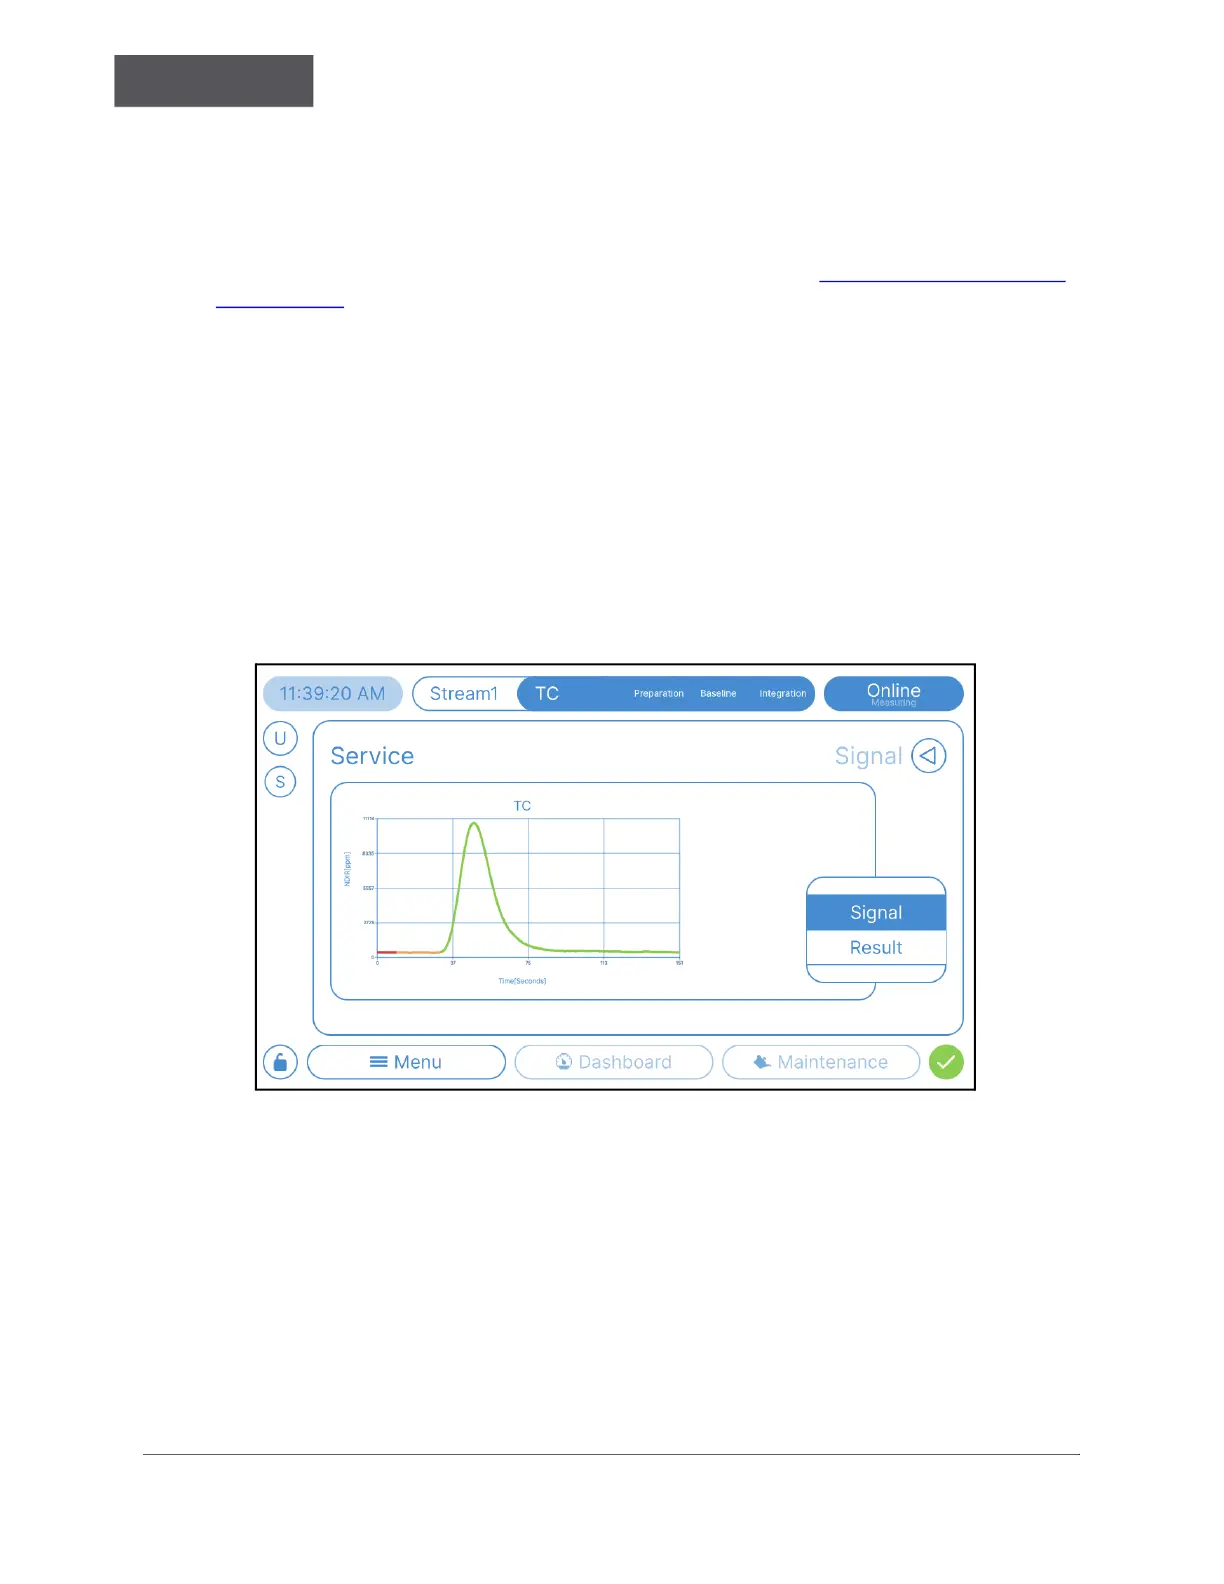
Signal
Use this screen to view the Detector(s) signals. In addition, it is recommended to
document the current Detector(s) baseline values prior to performing any Maintenance
tasks to use as a baseline for later. For more information, see “To Take a “Screenshot””
on page 106.
Signal
Chart View of the most recent analysis repetition. (X-Axis = Time [Seconds], Y-Axis =
Detector [ppm] Concentration). Signals and Peaks can only be viewed here and only in
real time.
Signal Line Color Key:
• Red — Baseline
• Orange — Integration Delay
• Green — Integration
Figure 4-30: Menu → Service → Signal → Signal
Result
The Analyzer displays real-time Online measurement results, which are updated
automatically after each measurement. The results are displayed both on the Signal view
and on the Dashboard.
 Loading...