BASIC ANALYZER OPERATION
Chapter 4
............
Sievers TOC-R3 Operation and Maintenance Manual
DLM 95000-01 EN Rev. A 151 © Veolia 2023
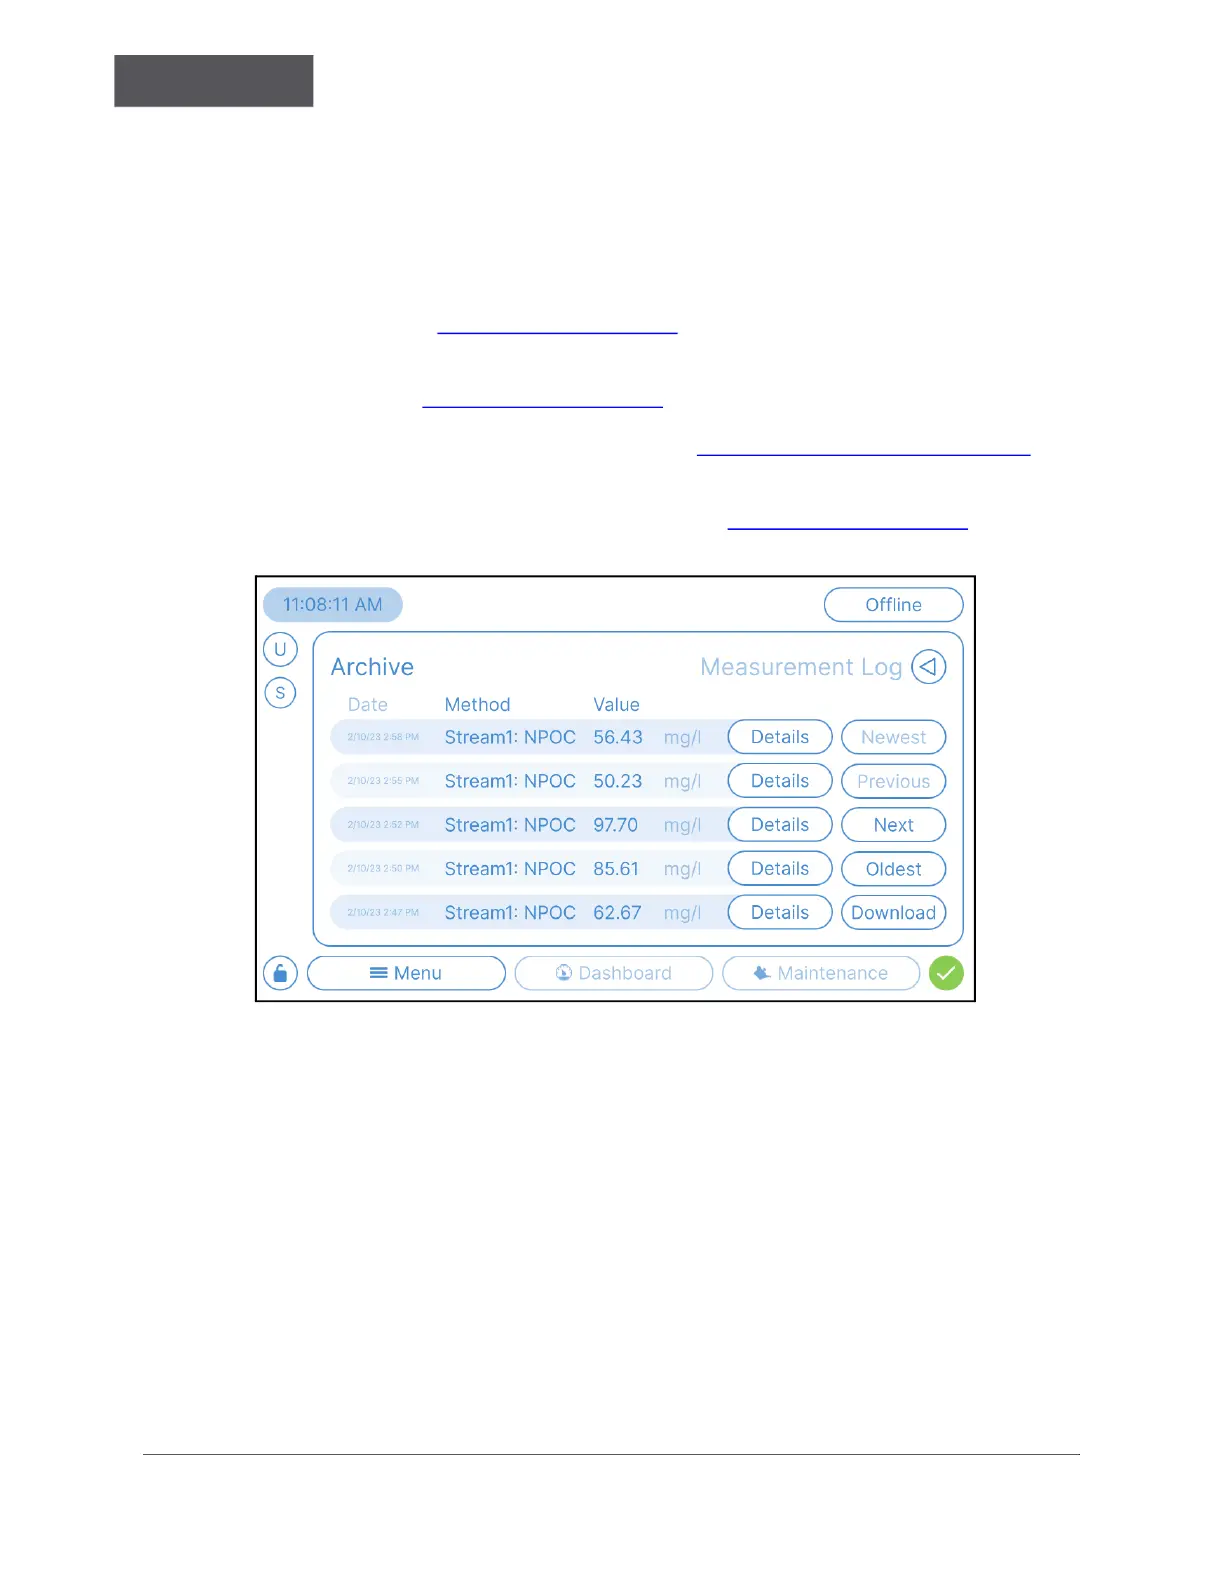
Measurement Log
The Measurement Log screen displays the results of a measurement sequence, the time
and date the analysis was performed, and the measured value in mg/L. The
measurement results displayed in the “Value” column can represent a single
measurement or an average measurement value from multiple Repetitions, depending on
the Method used. See Figure 4-45 on page 151
.
Select D
OWNLOAD to export the Measurement Log as a .CSV file to an attached USB
memory device. See Figure 4-45 on page 151
.
For more information on using the USB Port, see “Using the USB Port” on page 106
.
Select D
ETAILS to open a new view that contains the measurement graph, values for each
repetition, and the rejected outlier, if applicable. See Figure 4-46 on page 152
.
Figure 4-45: Menu → Archive → Measurement Log
 Loading...