9/29/09 System 824 Views 5-21
• Ln graph - Graph of Ln’s from 1 to 99 (1 being on the
left, 99 on the right). There are two levels represented by
each bar. The highest of the two are graphed.
Spectral LNs
To return to the Ln display menu, press the View
V key. To
view the Spectral Lns highlight “Spectral” and press the
check
c key to view a tabular spectral display.
NOTE: Spectral Lns are measured for
SSA instrument only. If a display
bandwidth of one octave is selected with
the “bandwidth” setting these displays
will indicate “No Data Available for1/1
octave”.
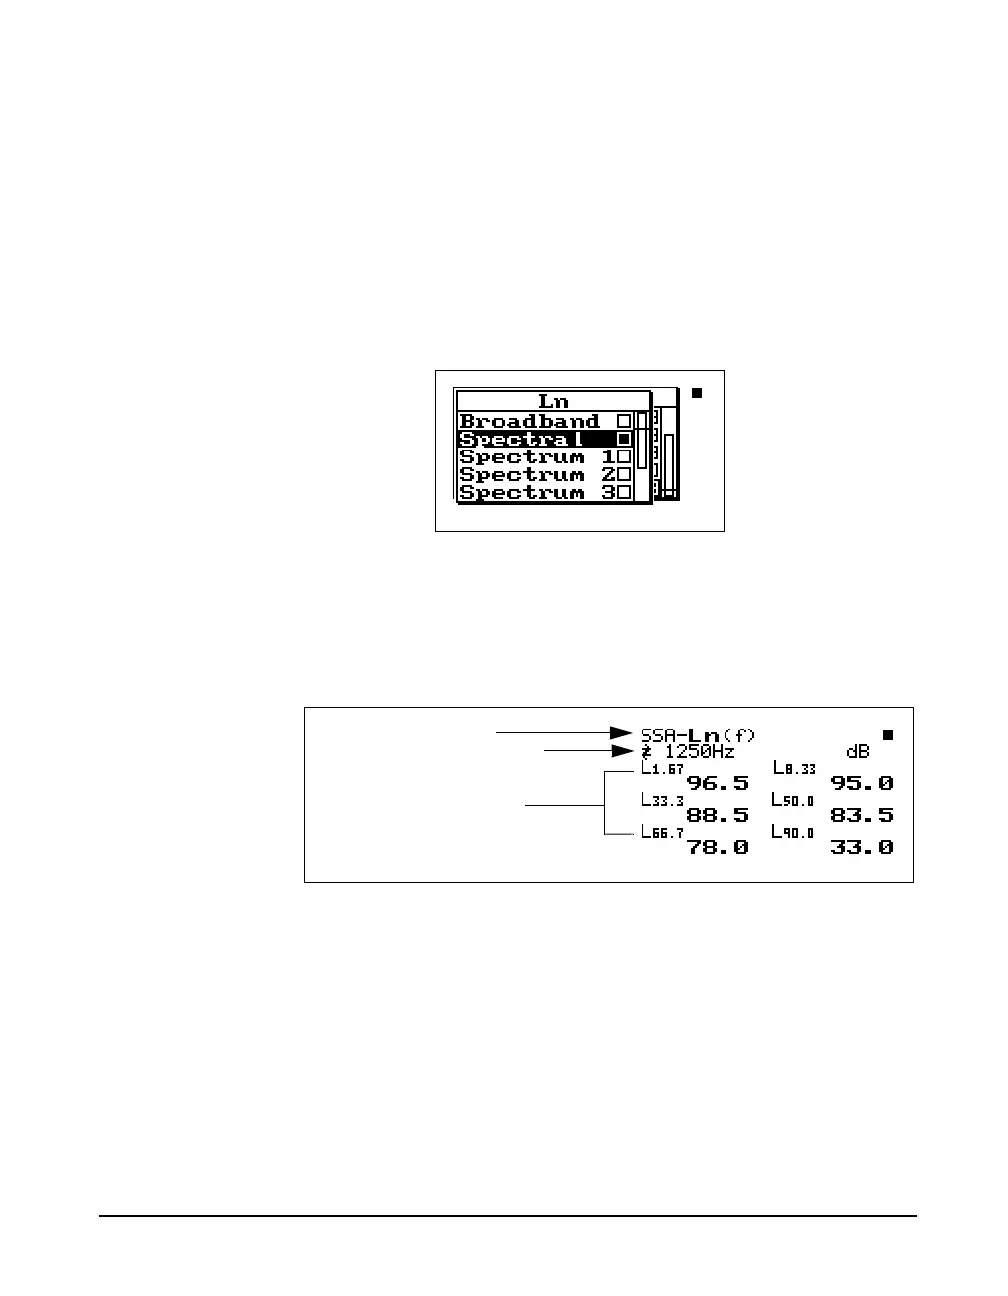
This is a tabular display for each 1/3 octave frequency
showing six Ln values for the selected frequency. Below is
an example of one of the displays shown for each frequency.
The following is a brief description of each of the
components of this display:
The ‘(f)’ indicates “Ln of frequency
f”.
• Display label - The Display label identifies the display
which is the SSA-Ln (f) display showing six Ln percent
values for the frequency displayed.
Use the right
rand leftlarrow
keys to move to each 1/3 octave
frequency.
• Selected frequency - Shows the values for the frequency
shown on the display
Display label
Percentile values & levels
Selected frequency