722 Data Collection and Analysis
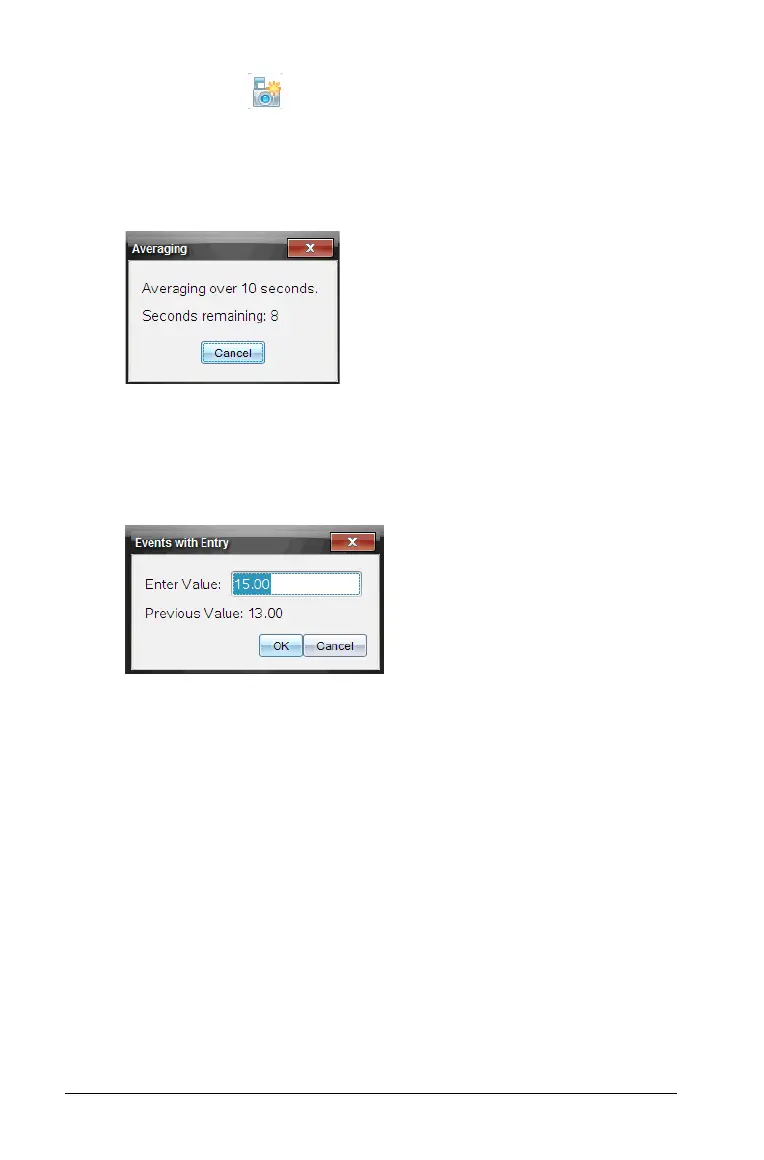
3. When ready, click . One of the following dialog boxes opens.
• If you selected “Average over 10 s,” the Averaging dialog box
opens with a count down displayed. When the seconds reaches
zero, it will record the data point in the appropriate location on
the graph.
• If you did not select “Average over 10 s”, the Events with Entry
dialog box is opened.
– Manually enter the value of your data point.
– Click
OK.
The data point is saved in the appropriate location on the graph.
The next point appears in the center of the graph.
4. Repeat step three until all your desired data points are captured.
5. Stop the collection.
Setting Selected Events
This collection mode allows you to capture samples manually. Events with
Entry and Selected Events are similar. The difference is that Selected
Events numbers the dependent column (1,2,3,...) where Events with Entry
ask you to define the independent value for each point you collect.
To set the collection mode as Selected Events:
1. Select Experiment > Collection Mode > Selected Events.
The Events with Entry Setup dialog box opens.

 Loading...


