3-14
Cisco Unified Communications Manager Managed Services Guide
OL-22523-01
Chapter 3 Managing and Monitoring the Health of Cisco Unified Communications Manager Systems
RTMT Monitoring of Cisco Unified CM System Health
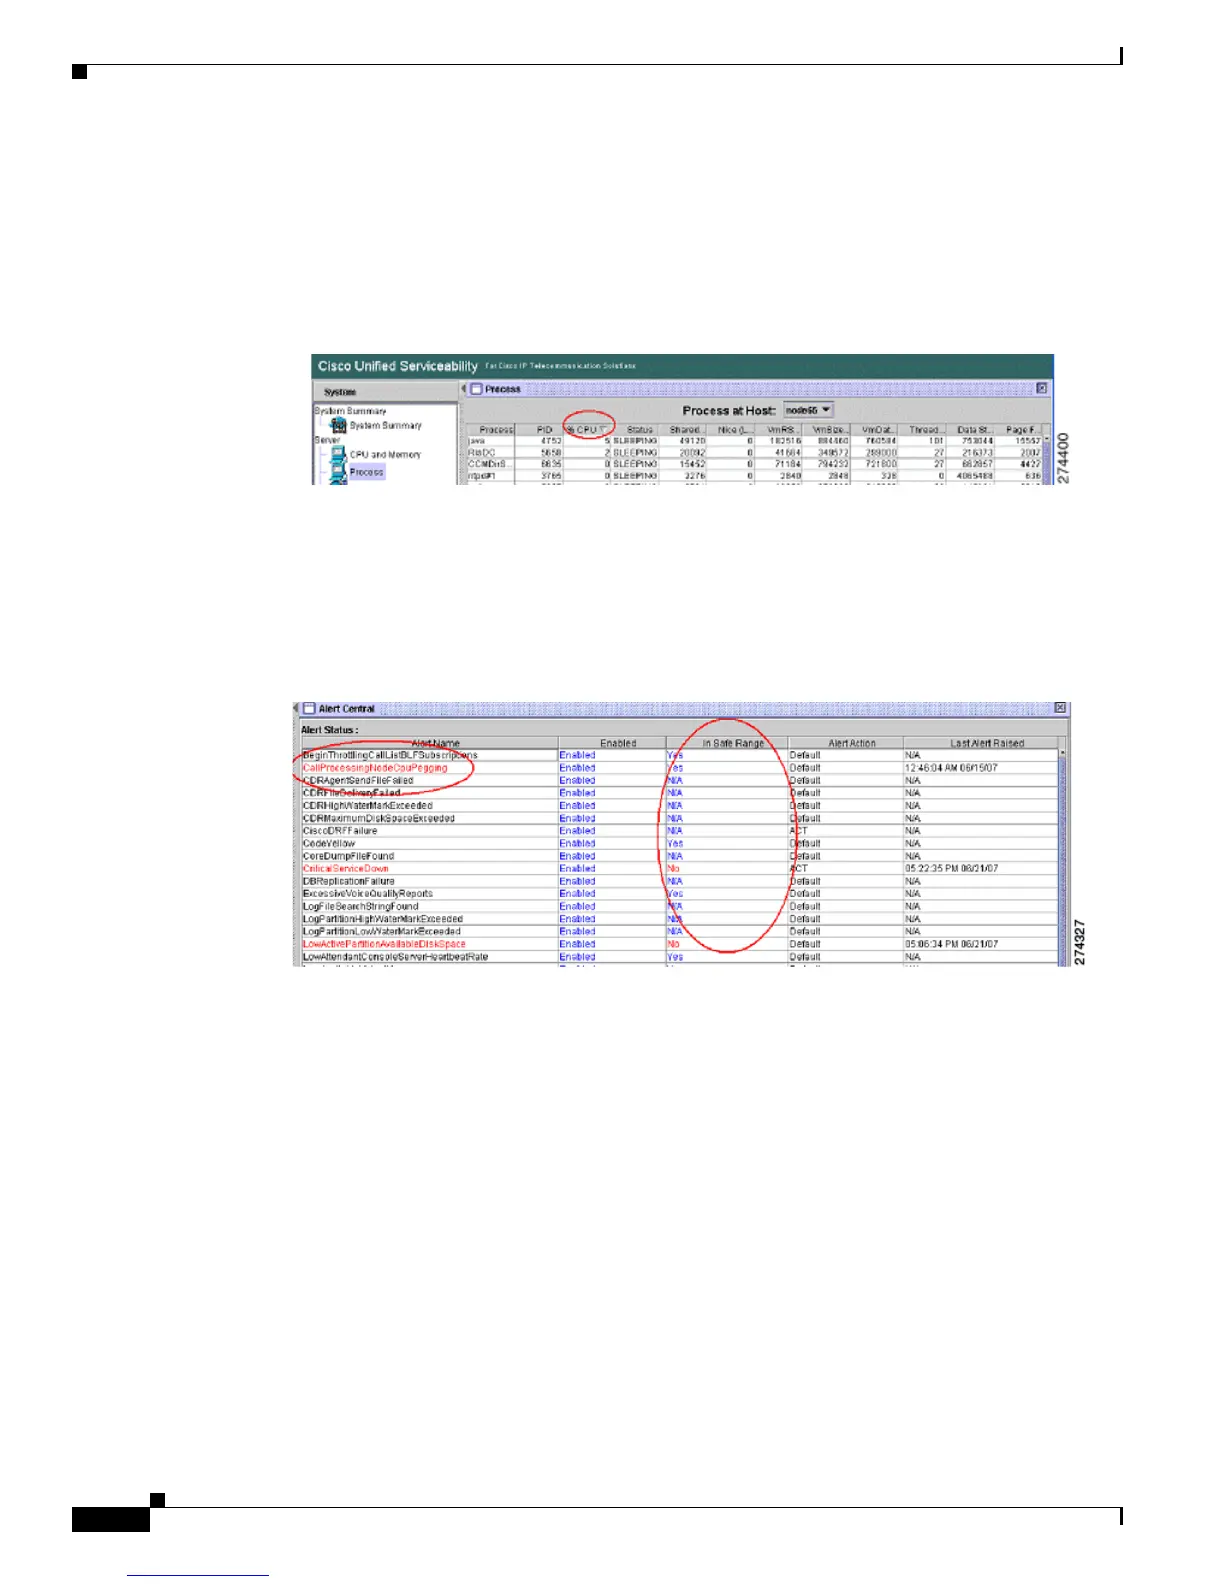
If you see high CPU usage, identify which process is causing it. If %system and/or %user is high enough
to generate CPUPegging alert, check the alert message to see the processes that are using the most CPU.
You can go to the RTMT Process page, sort by %CPU to identify high CPU processes.
Figure 3-2 shows the CPU usage.
Figure 3-2 Cisco Unified Serviceability CPU Usage
For analysis, RIS Data Collector PerfMonLog tracks processes %CPU usage at system level.
RTMT monitors CPU usage and when CPU usage is above a threshold, RTMT generates
CallProcessingNodeCPUPegging alert. Figure 3-3 shows the alert status.
Figure 3-3 RTMT Alert Central with Alert Status
Monitor the “In Safe Range” column often. If it is marked “No,” then the condition is not corrected. For
example, if In Safe Range column displays No for CallProcessingNodeCPUPegging, then it means the
CPU usage on that node is above the threshold and requires attention.
In addition to CallProcessingNodeCPUPegging, high CPU usage potentially causes the following alerts
to trigger:
• CodeYellow
• CodeRed
• CoreDumpFileFound
• CriticalServiceDown
• LowCallManagerHeartbeatRate
• LowTFTPServerHeartbeatRate
• LowAttendantConsoleHeartRate
 Loading...