Interactive SourceMeter® Instrument Reference Manual Section 2:
2450-901-01 Rev. B/September 2013 2-29
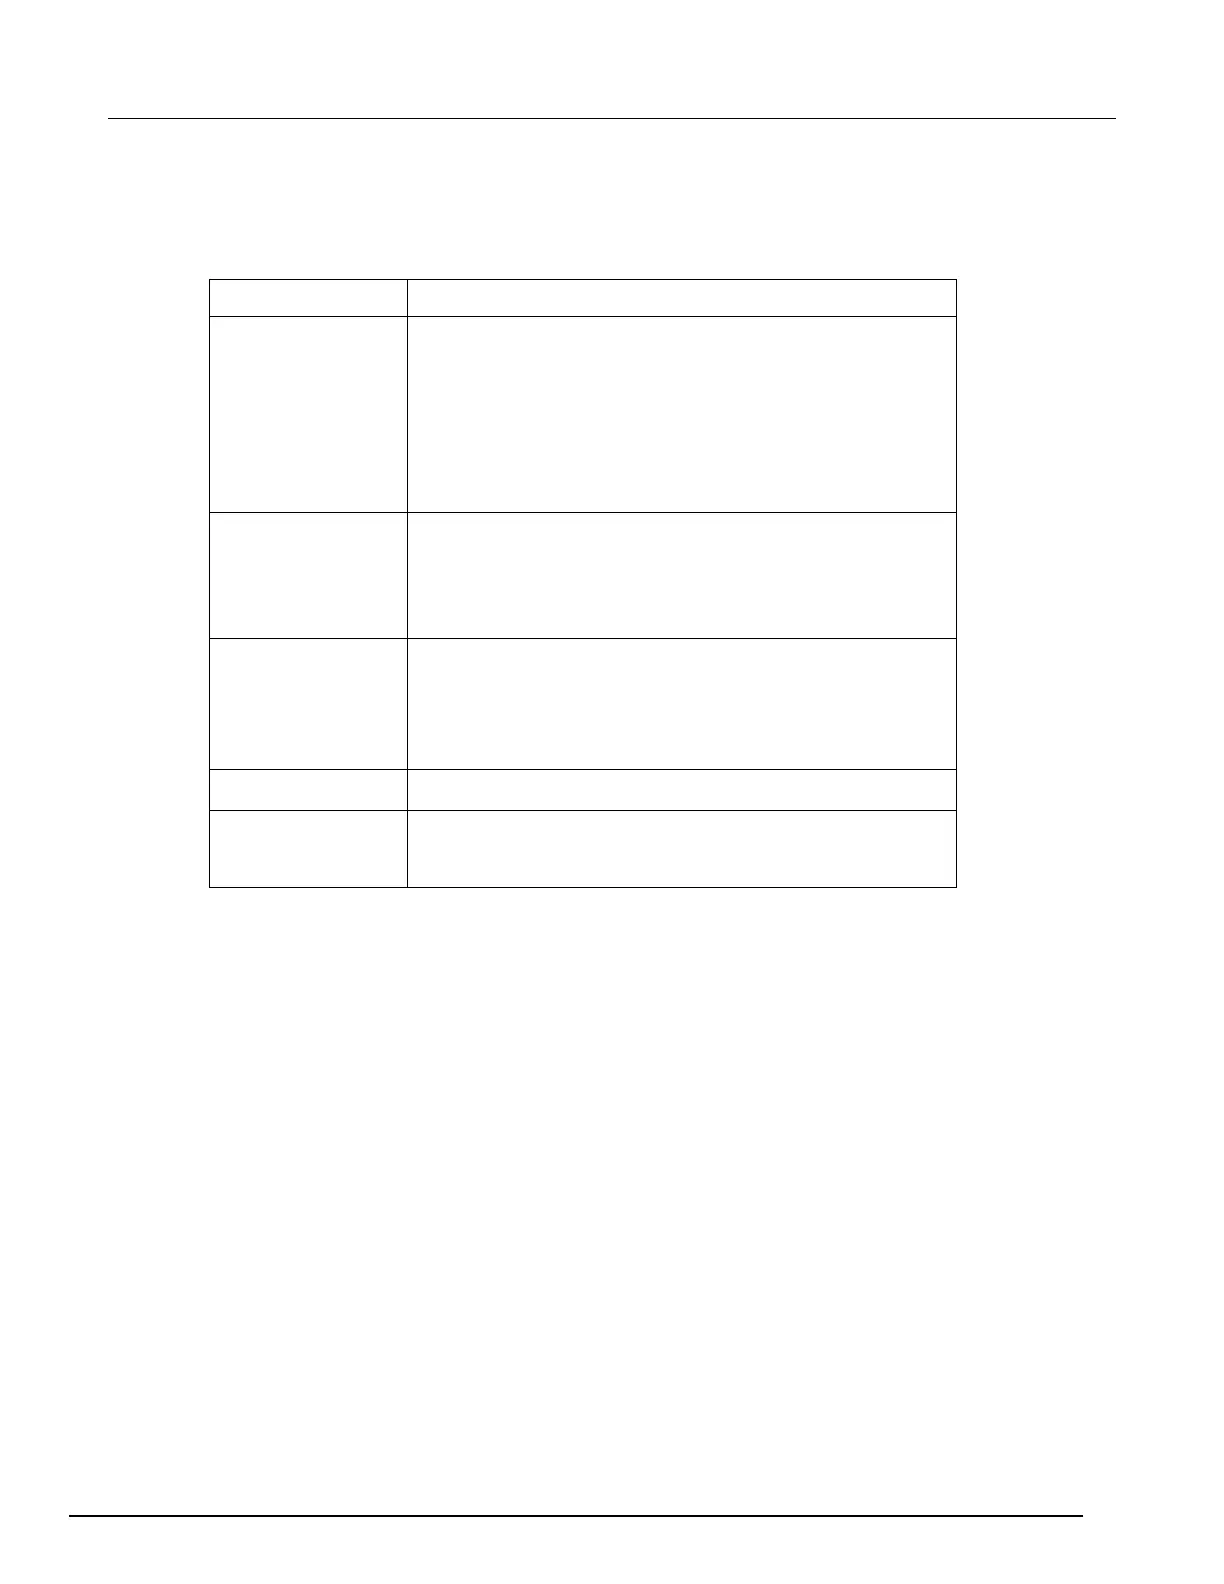
Scale tab
The Scale tab contains settings that allow you to fine-tune the output on the Graph tab.
Scale tab setting Description
Scale
Set the reading value scale for each division for the function
selected.
The choices you see for this setting are directly related to what you
have chosen to plot on the X or Y-axis (on the Data tab). For
example, if you have chosen to plot Time on the X-axis, your
selections on for the X-axis on the Scale tab will be seconds.
For example, if you are sourcing current, you can specify that the
value of the divisions on one of the axes on the graph are set to 1
Min Position
You can set the first visible value on the graph; the default setting
is 0. The choices you see for this setting are di
you have chosen to plot on the X or Y-axis (on the Data tab). For
example, if you have chosen to plot Time on the X-axis, your
selections on for the X-axis on the Scale tab will be seconds.
When the Auto Scale feature is on, the graph is scaled
automatically to fit all the data that is in the selected reading buffer.
If Auto Scale is off, the graph does not resize. You can scroll right
or left to view the data.
Note that if you pinch or swipe the display on the graph tab while
readings are being made, Auto Scale is turned off.
You can turn the Auto Scale function on or off for the Y-axis.
Select the Linear scale type to increase the step size on the graph
in even increments. Select the Logarithmic scale type to increase
the step size exponentially.