2: General operation Model 2450 Interactive SourceMeter® Instrument
2-28 2450-901-01 Rev. B/September 2013
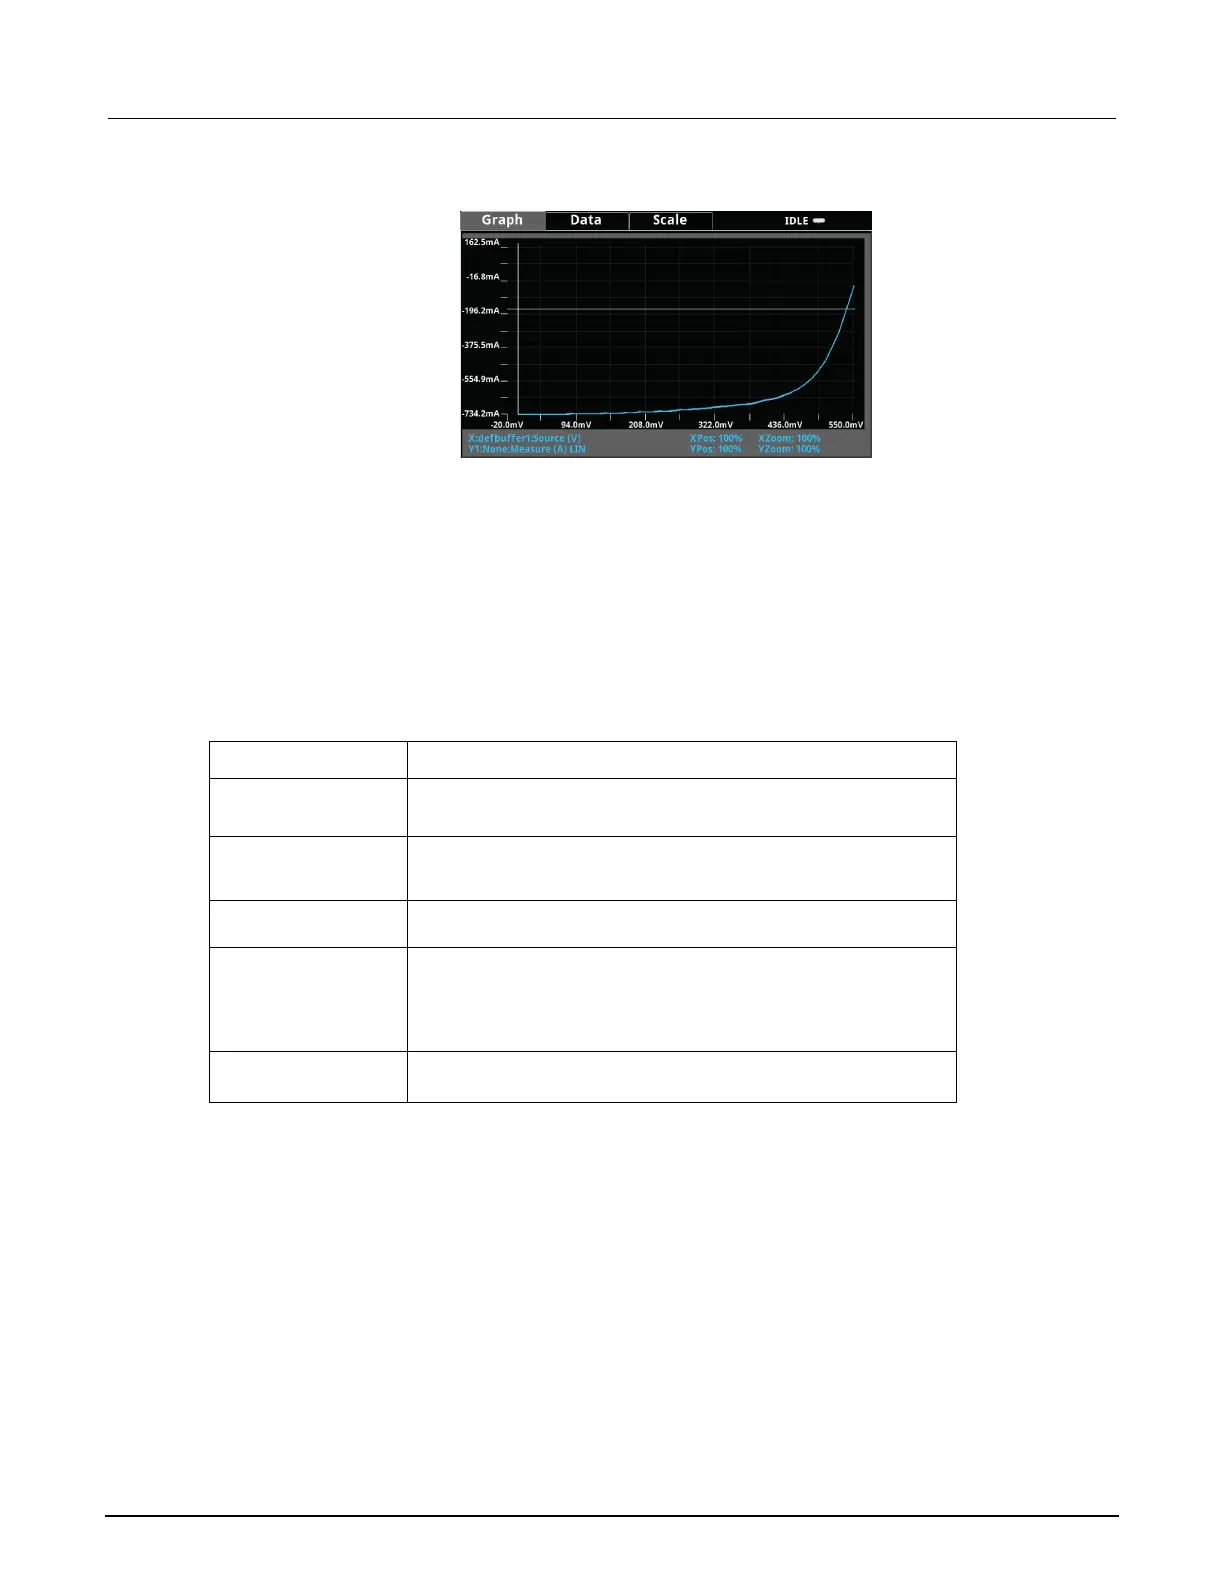
Figure 18: Graph tab
You can zoom in or out in the graph view by placing two fingers on the screen and moving them
together or apart in a pinching motion. You can also move the view of the graph to the left or right by
placing a finger on the screen and moving it in either direction.
The X and Y axes can be set to show different values appropriate for your application. The bottom of
the Graph tab contains a legend of the active axis and scale settings for the graph.
Data tab
The data tab contains settings that define what data will be shown in the graph.
Data tab setting Description
Select the button next to Buffer to select the buffer that contains
the readings to be graphed.
Select Clear to clear the selected buffer.
Select the button next to X-Axis to select the data that is plotted on
the X-Axis. You can select Source or Time.
Select the button next to Y-Axis to select the data that will be
plotted on the Y-Axis. You can select either Measure or Source.
Note that if you have Source selected for the X-Axis and you try to
set the Y-Axis to Source, you will receive an error message.
When Time is selected for the X-Axis, you can select the statistic to
be graphed: Min/Max, Average, or Both.