Using Graphs & Geometry 95
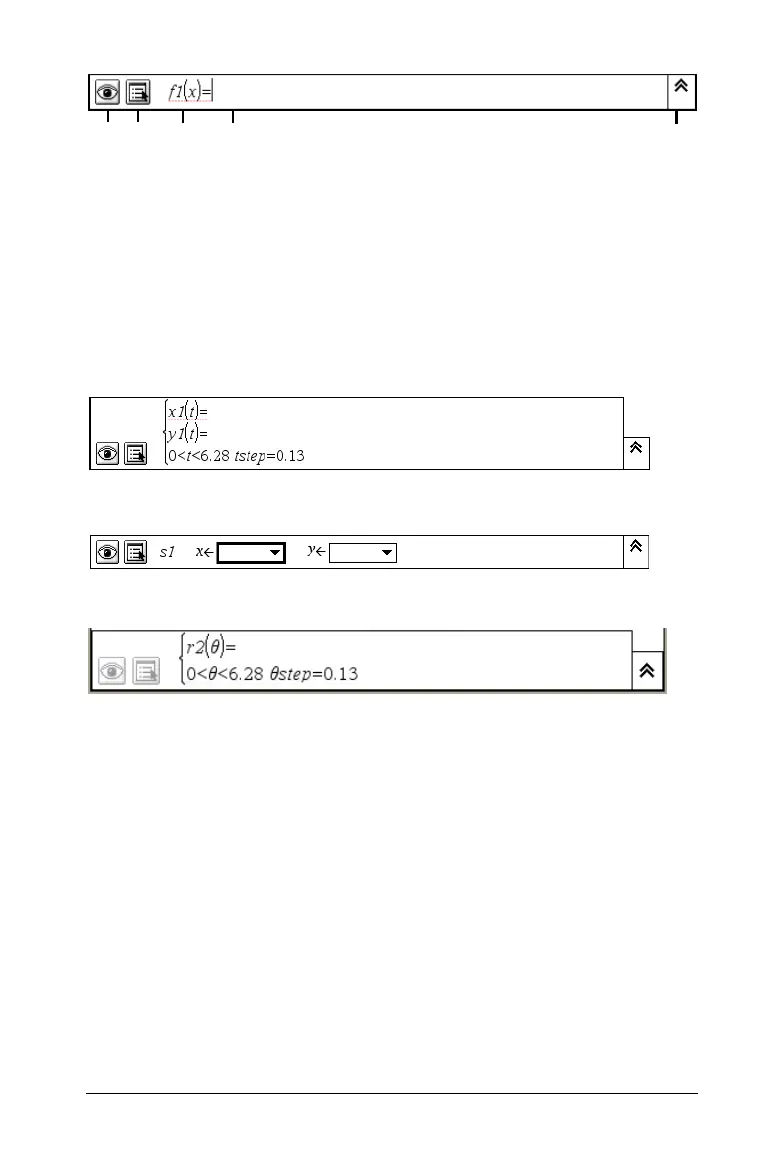
From left to right, the parts of this line are:
À Hide/Show function button.
Á Attributes button.
 f1(x)= is the default notation for a function or inequality.
à Blank area into which you enter the function, polar equation,
inequality, parametric, or scatter plot data to be graphed.
Ä Expand/Contract (History) button.
ÀÁ Â Ã Ä
Parametric Mode entry line.
Scatter Plot Mode entry line
Polar Mode entry line

 Loading...


