202 Using Lists & Spreadsheet
1. Right-click the cell to display the context menu.
2. Select Delete Cell.
Note: If you press Delete or Backspace to clear the contents of the cell
instead of deleting the list element, the element is assigned a value of 0
(zero). The remaining list elements do not shift.
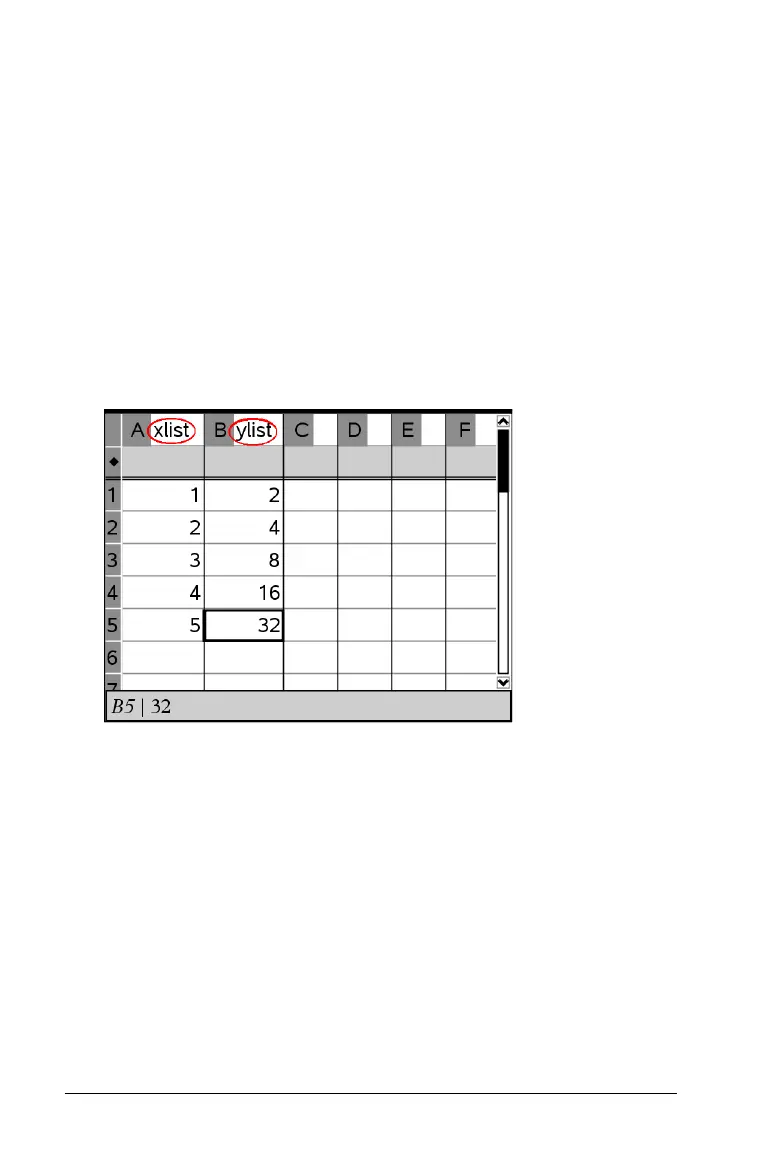
Graphing spreadsheet data
You can easily create a dot plot of the data in one column or a scatterplot
of two adjacent columns by using the Quick Graph feature. This feature
displays the graphed data using the Data & Statistics application.
To create a scatterplot:
1. Name both of the two columns to declare them as lists.
2. Select both columns.

 Loading...


