Using Data & Statistics 251
Getting started with
Data & Statistics
The Data & Statistics application is designed as a place to explore and
visualize data and graph inferential statistics. It is, therefore, best used in
conjunction with a numerical application like Calculator or Lists &
Spreadsheet.
Creating plots from spreadsheet data
The Quick Graph feature of Lists and Spreadsheet is the easiest way to
plot data using the columns in a spreadsheet.
Plotting data from Lists & Spreadsheet
1. Create or display data to be plotted in Lists & Spreadsheet. You can
plot one or two columns of data.
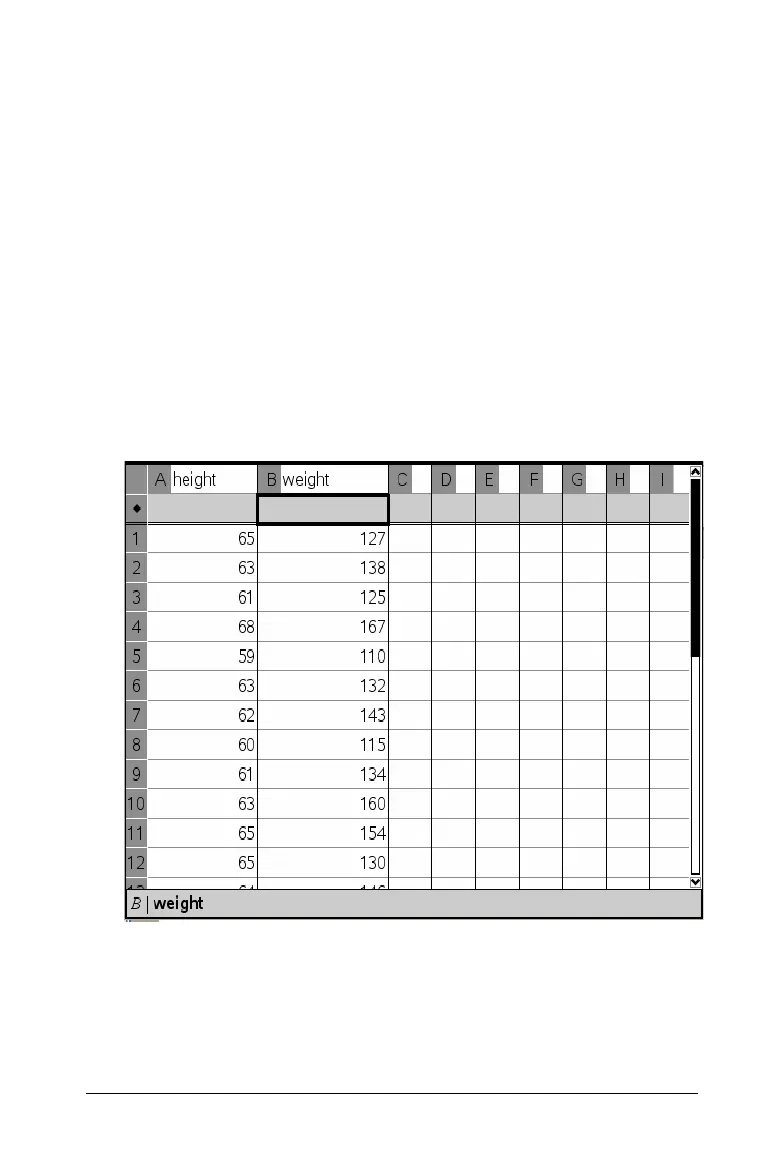
The example below illustrates two named columns, height and
weight.
Important: You must name each column of data in Lists &
Spreadsheet in order to plot the data in Data & Statistics.
2. Highlight at least one column of data in Lists & Spreadsheet.

 Loading...


