Using Graphs & Geometry 167
If no other animated points are on the page, the animation control
box does not reappear when the velocity is set to 0.
Note: If you have multiple points in motion on one page and want
to permanently stop the animation of all objects, when motion is
paused or stopped, display the attributes bar for each point and
change the velocity to 0.
Plotting collected data
In addition to using Graphs & Geometry by itself, you can use it to
explore the data collected from scientific instruments or stored in lists.
Using data to create plots can be more helpful in understanding and
interpreting data than just examining the raw values.
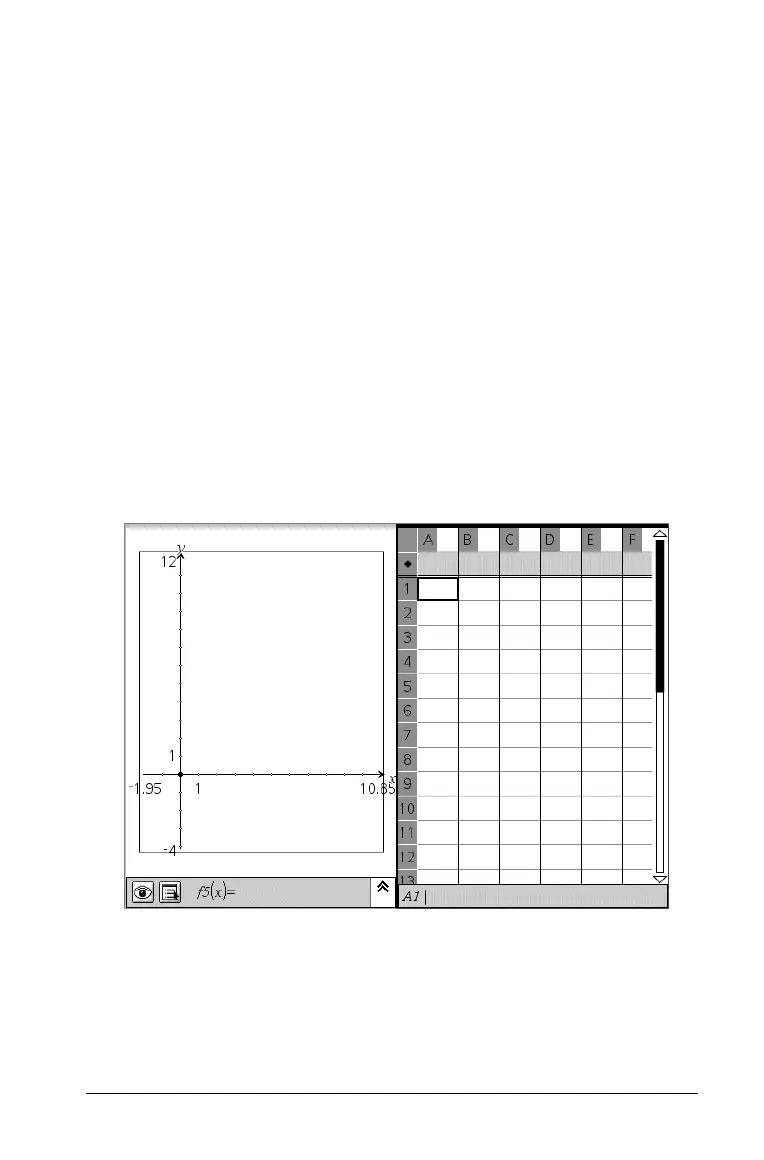
Creating a scatter plot
If you do not have an existing set of data points available for plotting,
create them on the same page using the Lists & Spreadsheet application.
1. To create the data lists and scatter plot on the same page, select a
page configuration with two work areas.

 Loading...


