168 Using Graphs & Geometry
2. Create the data lists on the Lists & Spreadsheet portion of the page.
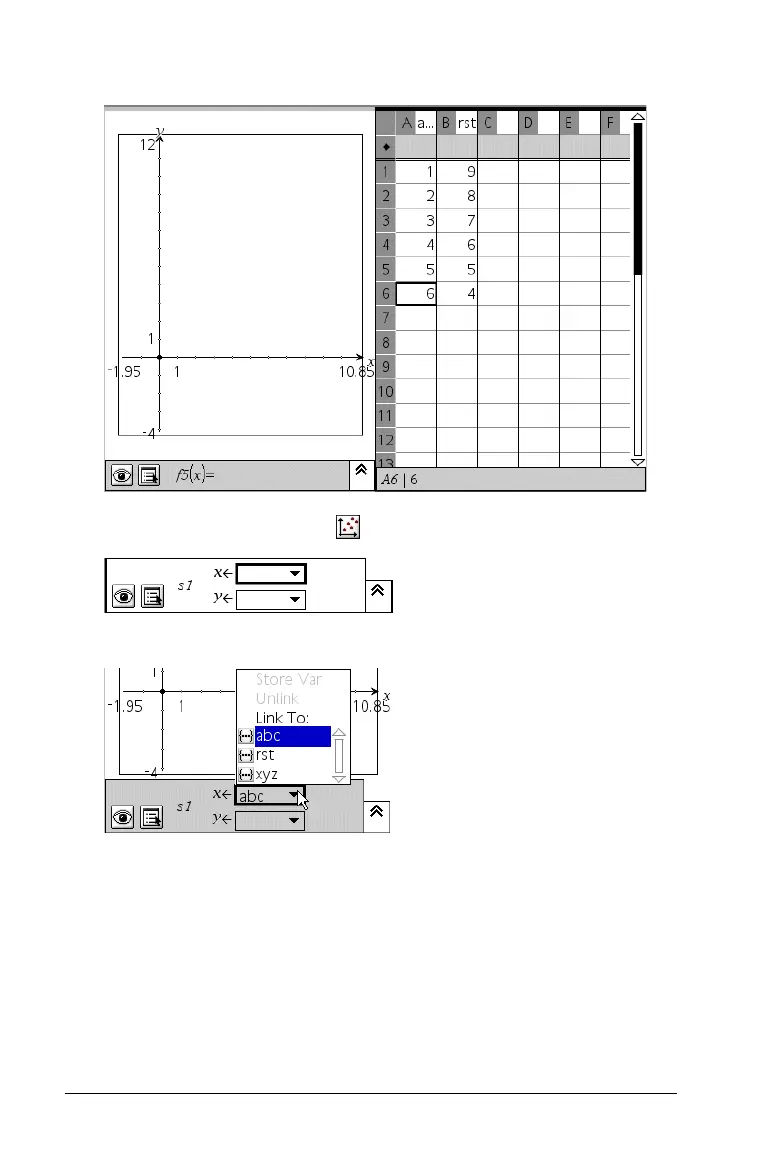
3. Select the Scatter Plot tool ( ) .
4. Select the lists to plot from the drop down list for each axis.
When both entry fields have a data list specified, the scatter plot
displays on the Graphs & Geometry work area.

 Loading...


