Using Lists & Spreadsheet 209
Á Function table view
Generating a function table
1. Make sure you have defined at least one function in Graphs &
Geometry, Calculator, or Data & Statistics. Refer to Using Graphs &
Geometry for more information.
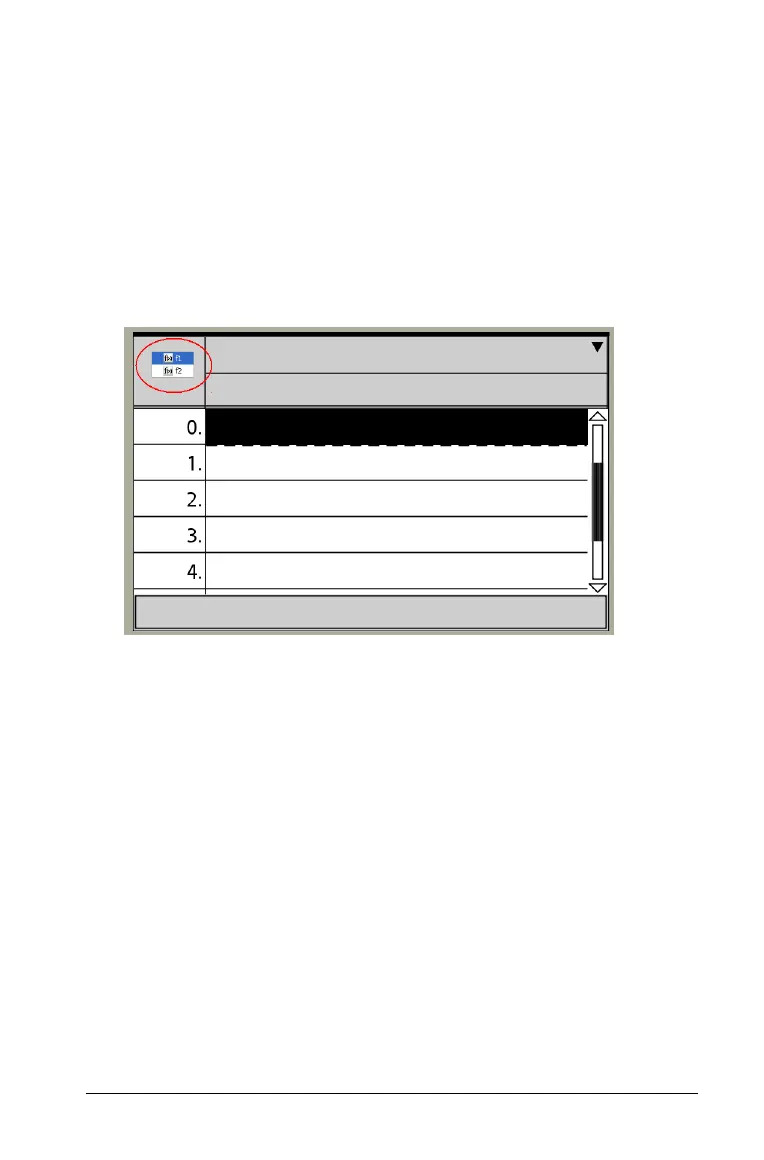
2. In Lists & Spreadsheet, press Ctrl T to toggle to the function table
view.
The function table view appears with a small box listing available
functions.
Note: If a previous function is displayed, press ¢ to move to an
empty column.
3. Select the function for which you want to create a table.
By default, the table is generated using a start value of 0, a step
value of 1, and the automatic setting for the independent and
dependent variables.

 Loading...


