82 Using Graphs & Geometry
The graphing view
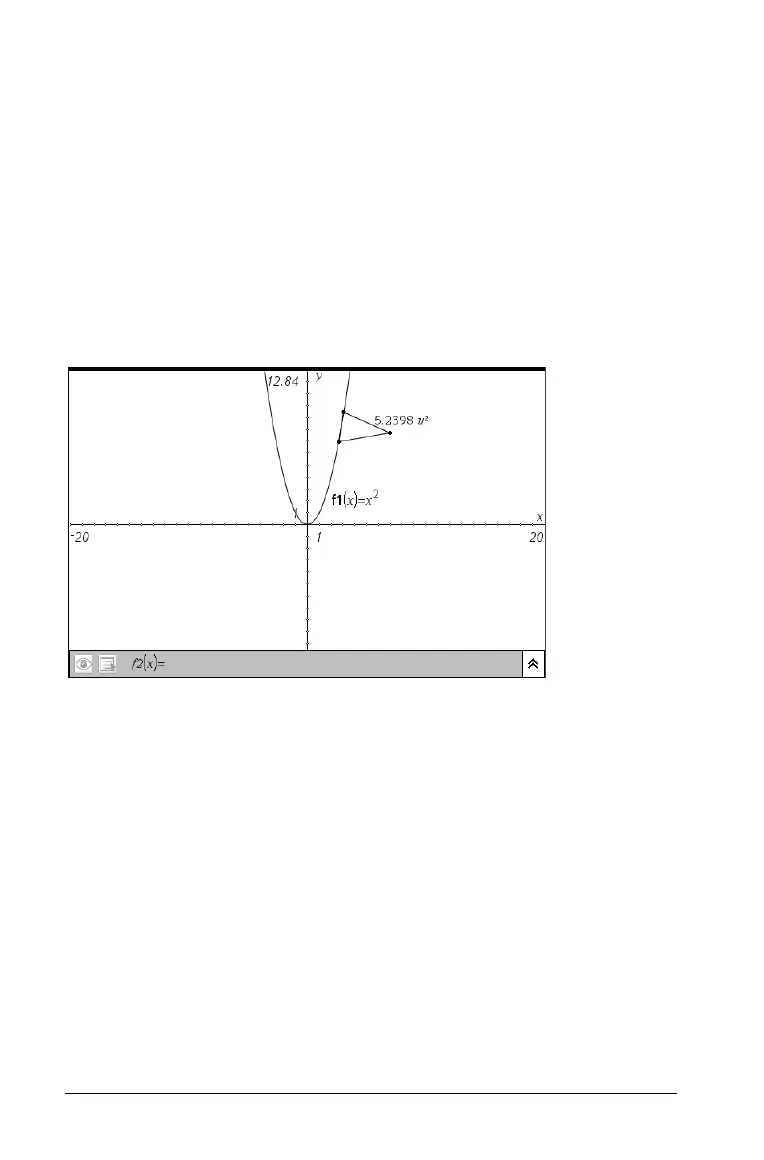
The graphing view is the default Graphs & Geometry work area display. It
contains:
• the default Cartesian axes in the Zoom Standard format (1:1
scale).
• the entry line from which you can graph up to 100 functions.
Axes, entry line, and grid can all be displayed or hidden, but in this view,
no scale for any drawn shapes (e.g. Circle, etc.) can be displayed. All
objects created in this view are analytic objects. Therefore, their
displayed size and proportion are affected only by the scale of the axis
system (the command "Show Scale" has no effect).
The plane geometry view
The plane geometry view removes the axes and entry line from the work
area to enable you to draw geometric shapes and explore them. In this
view, you can display and set a scale for your drawings.
To change to Plane Geometry view:
1. From the View menu, select the Plane Geometry View tool.
2. The display refreshes to clear the axes and entry line and display a
default scale. Any graphs or drawings created in graphing view are
not displayed on the plane geometry area.
To return to graphing mode:
f From the View Menu, select the Graphing View tool.

 Loading...


