246 Using Data & Statistics
The Tool menu
The Data & Statistics tool menu provides tools to graph and explore data,
modify data representations by using different plots, as well as perform
and plot statistical analyses.
The following tables describe what each tool does in the Data & Statistics
work area.
Tool Menus
Plot Types Menu Tools
Menu Overview of Tool Actions
Plot type Provides access to the different plot types
available in the Data & Statistics application.
Plot properties Allows you to specify how the plot displays
Actions Lets you add/remove items to your work area.
This includes movable lines for manually
fitting data, regression curves and functions.
Window/Zoom Lets you specify a zoom factor for the window,
or determine min and max values for the
horizontal and vertical axes.
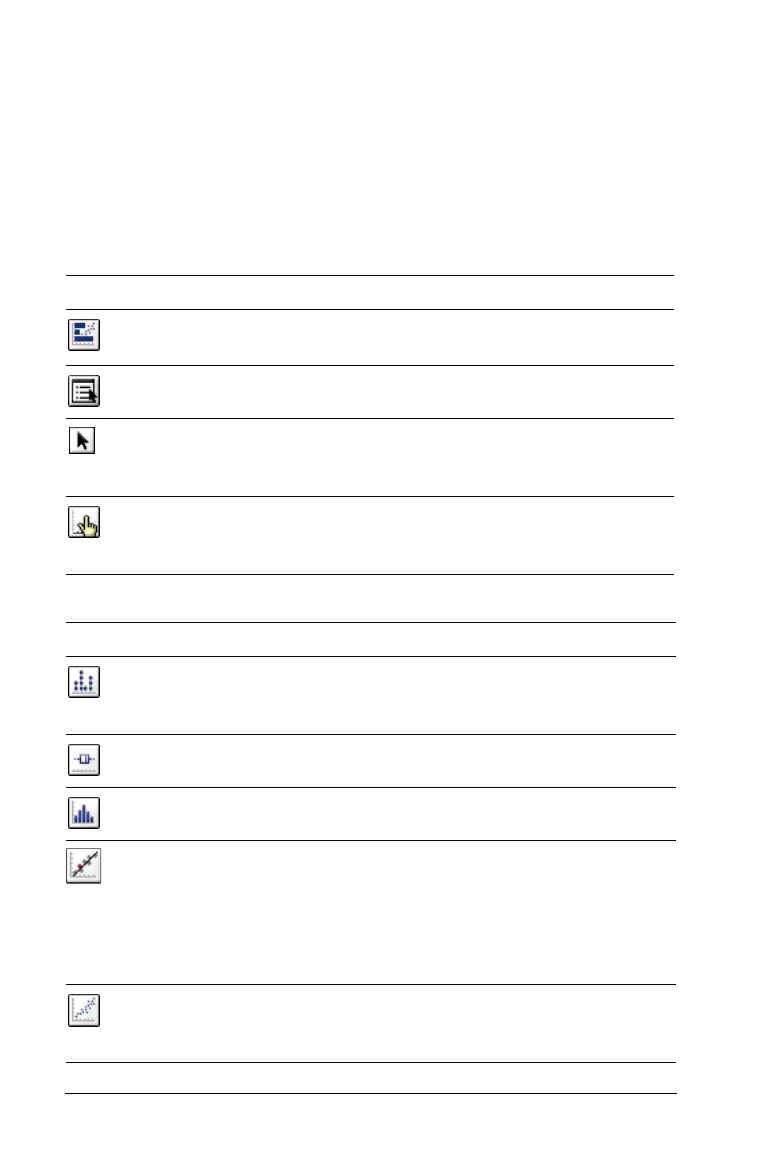
Tool name Tool function
Dot Plot Depicts data in a dot plot. This is the
default plot type for a single variable of
the data set.
Box Plot Displays data in a box plot.
Histogram Displays data in a histogram.
Normal Probability Plot Displays data in a normal probability
plot. Data is grouped against the z-value
that corresponds to its quartile/normal
score. This plot type is useful for
checking for normality and determining
the appropriateness of a normal model.
Scatter Plot Displays data in scatter plot form. This is
the default plot type for two variables
of the data set.

 Loading...


