300 Using Data & Statistics
Using Shade Under Function
Use Shade Under Function to find the area of a selected region under a
function graphed in the work area.
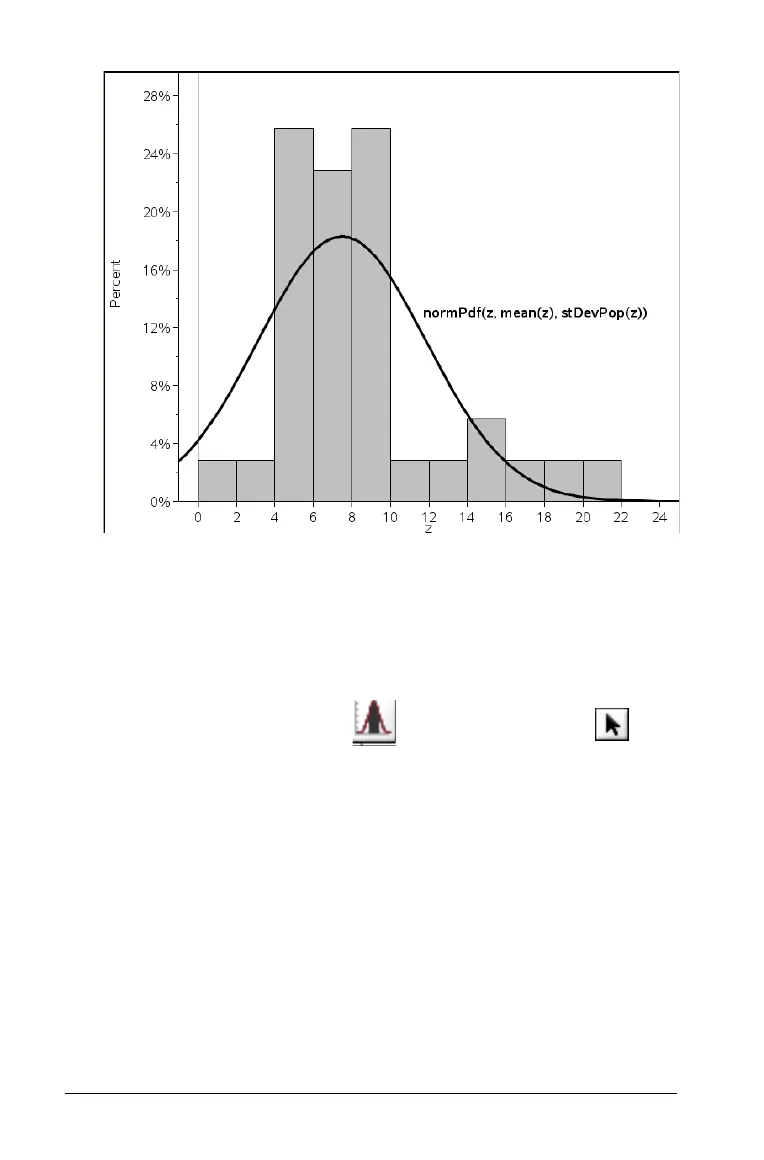
1. Select any function graphed in the Data & Statistics work area. For
example, select a previously graphed normal PDF.
2. Select Shade Under Function ( ) on the Actions menu ( ).
The cursor becomes a dotted vertical line and the boundary +/- ˆ
displays when you position the mouse near the boundary on the left
or right. You can click when ˆ displays to set it as a boundary.

 Loading...


