72 Using Graphs & Geometry
Getting acquainted with Graphs & Geometry
f Open the TI-Nspireé computer software, and add the Graphs &
Geometry application to your page.
When you add Graphs & Geometry to a page, your work area contains
the x and y axes for a graph, as well as a function entry line and Graphs &
Geometry-specific tools.
The basic components of the Graphs & Geometry application are the:
• Tool menu line
• Work area (which contains the axes)
• Entry line.
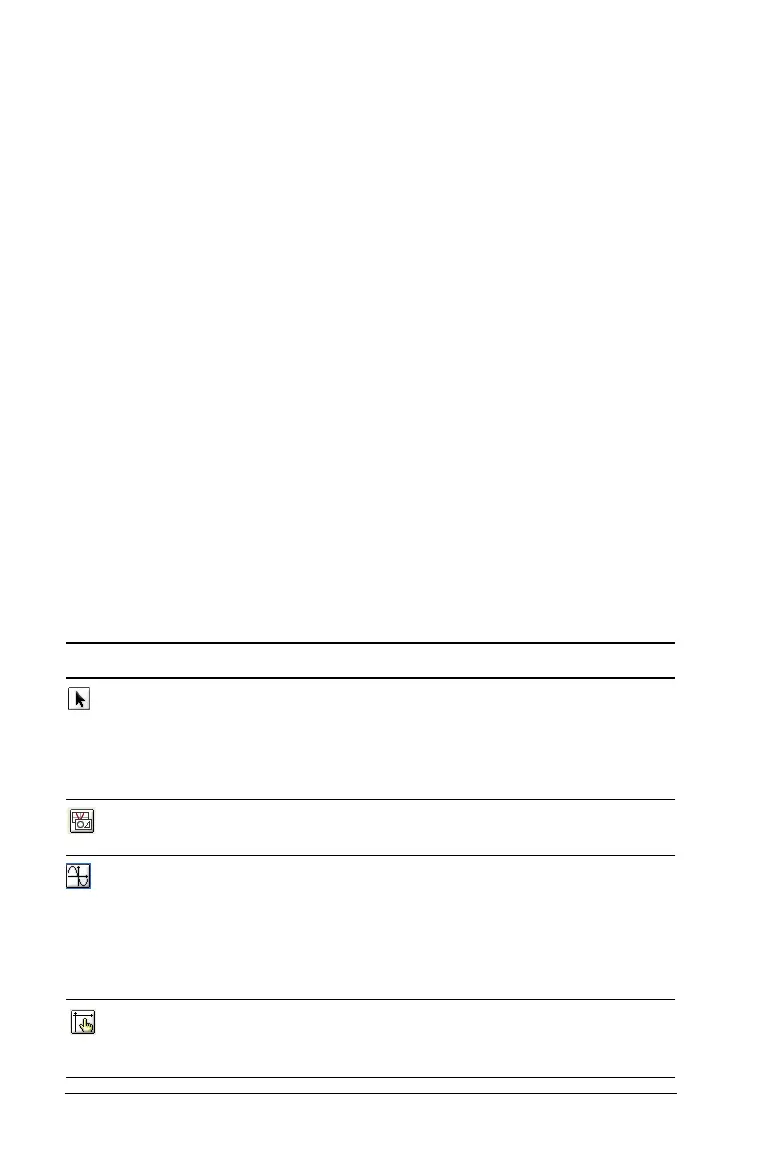
The Tool menu
The Graphs & Geometry tool menu appears immediately above the work
area on the screen. It displays icons for menus that contain tools which
enable you to graph and explore different types of functions, draw and
explore geometric structures, as well as other capabilities which will be
covered in this chapter.
The following tables contain a brief summary of what each menu
contains or tool enables you to do within the Graphs & Geometry work
area.
.
Menu Option List Overview of Tool Actions
Actions Provides tools to access the pointer, hide or
show various graph features, add text,
delete all objects in the work area, access
the calculate tool, and access the attributes
for an object or function.
View Provides tools to manipulate the work area
features and display.
Graph Type Enables you to select the type of graph to
plot in the work area: function, parametric,
polar, or scatter plot. The entry line below
the work area shows the notational
conventions to use to specify a function for
the selected graph type.
Window Provides different Zoom settings as well as
the ability to define the x- and y-axis
minimums and maximums.

 Loading...


