Using Graphs & Geometry 139
The measurement is transferred in a counter-clockwise direction, and
the starting and ending points of the value are marked by points.
The arc defined on the circle has the same measure as the
transferred value.
Note: If you measure the distance between the two points on the
circle, the value will be less than the transferred measurement. The
straight line between the points is measured, not the arc formed
between the two points. The arc’s length is the transferred
measurement.
Measuring graphs and objects
You can obtain various measurements from the functions you graph and
the objects you draw. These measurements include finding areas,
perimeters, lengths, angles, and slopes. The metric system is the default
for units of measurement.
Note: Document settings are available under the
File menu.
Identifying equations for circles and lines
You can display the equation of any Analytic object (constructed in the
Graphing View, or within the Analytic Window of the Plane Geometry
View) and label it on the screen. To do this:
1. On the Graph work area view, create a circle or line.
2. From the Actions menu, select the Coordinates and Equations tool
().
3. Click or press
Enter to select the circle or line.
The equation for the circle or line displays and the object blinks on
the screen.
4. Click or press Enter to anchor the equation on the screen.
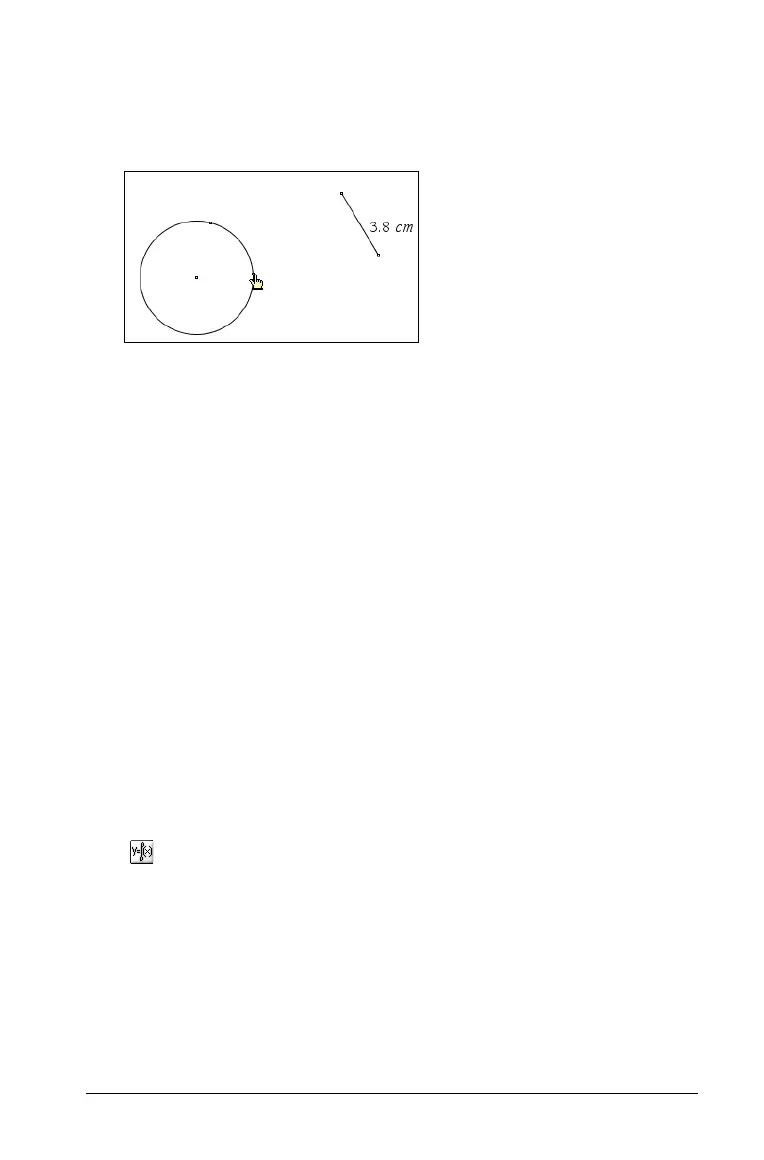
The segment length was
transferred onto the circle. The
two points on the circle define
this length. The hand cursor
shows the starting point for the
transfer.

 Loading...


