Using Data & Statistics 261
Creating a standard boxplot
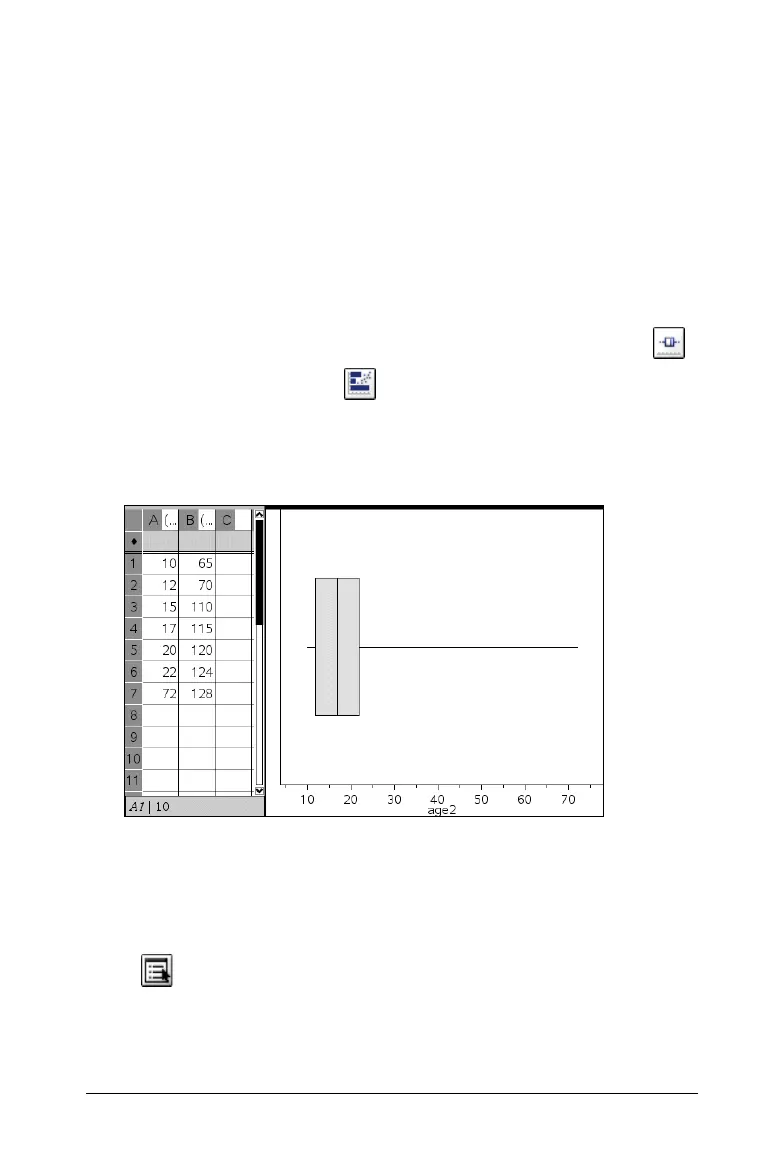
You create a standard boxplot by modifying the whiskers of the default
(modified) boxplot. In a standard boxplot, the whiskers are plotted using
the minimum and maximum points in the data set. No attempt is made
to identify outliers. The whiskers on the plot extend from the minimum
data point in the set (x-min) to the first quartile (Q1) and from the third
quartile (Q3) to the maximum point (x-max). The box is defined by Q1,
Med (median), and Q3. See the Definitions section at the end of this
chapter for a definition of Quartile.
To change the boxplot from modified to standard
1. Create a boxplot for one variable by selecting the Boxplot tool
from the Plot Types menu .
2. Right-click to display the context menu, and select Extend Box Plot
Whiskers.
The box plot is redrawn to display the whiskers you selected.
To return the boxplot to its original display, right-click to display the
context menu and select Show Box Plot Outliers.
Extending Box Plot Whiskers
You can select Extend Box Plot Whiskers from the Plot Properties tool
menu to extend the whiskers to the min and max of the data. You
can also right-click and select Extend Box Plot Whiskers from the context
menu, as shown in the example below.

 Loading...


