Using Data & Statistics 275
3. Click the name of the list that you want to plot in addition to data
previously plotted on the y-axis.
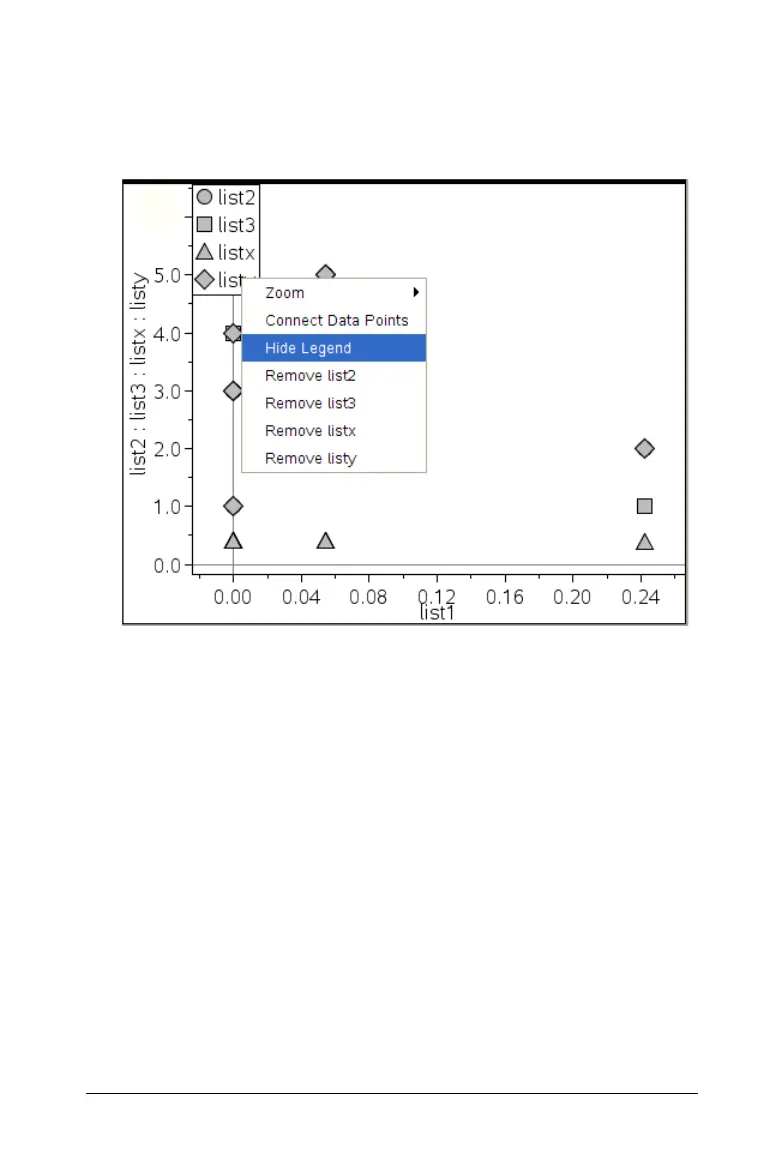
After you select a second variable for plotting, a legend displays at
the top of the work area.
The legend shows each shape used to distinguish between the
different variables used in a multiple plot. You can change the plot
of multiple lists in the following ways:
• Use the context menu to show or hide the legend of shapes
thatdistinguish plots
• Click the variable names on the y-axis and click Remove Y
Variable to remove the last variables plotted.
Exploring data
You can manipulate and explore plotted data in the following ways:
• selecting and moving points or data bins.
• changing the type of plot.
• rescaling the graph.
• adding a movable line.
• showing regression lines.

 Loading...


