282 Using Data & Statistics
Note: When a list is defined in Lists & Spreadsheet as a formula, the
movement of points is restricted to only points that satisfy that
formula.
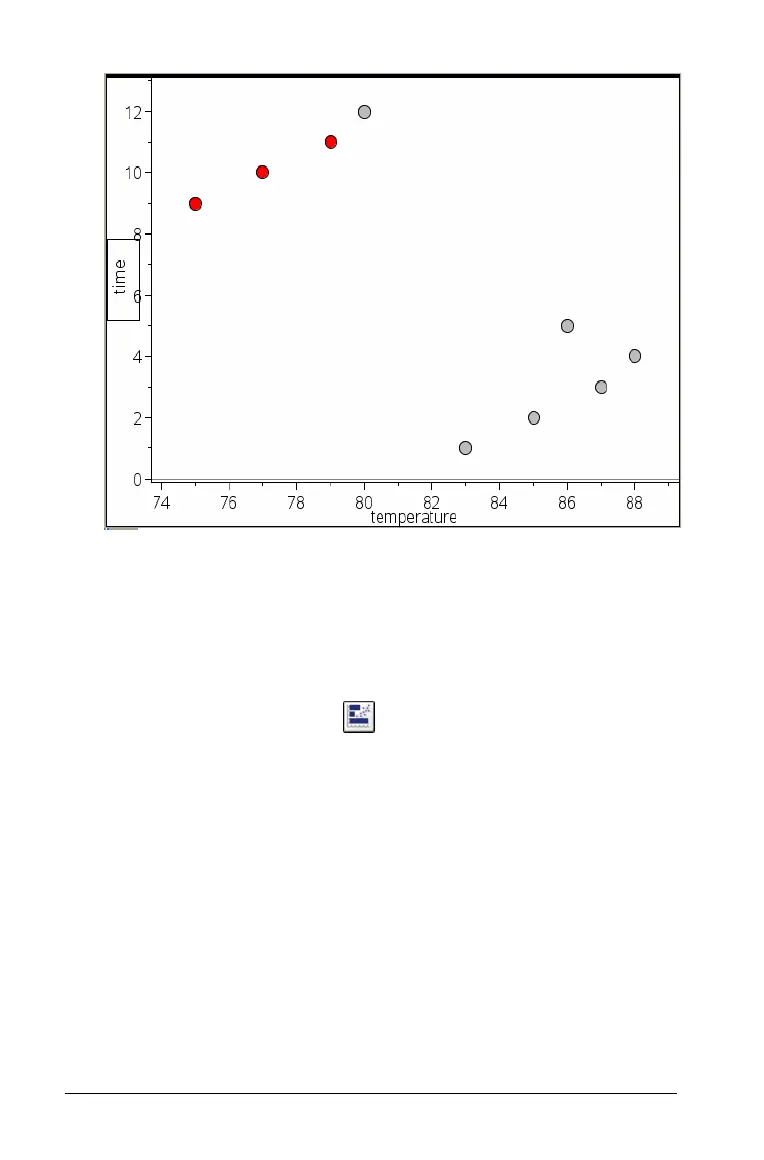
Changing plot type
You can change the plot type, to view different representations of data.
f Display the Plot Types menu , and select the new plot type. The
data representation changes to the new plot format.
Note: Options are greyed out on the menu if your data cannot be
represented by the plot type. For example, if a scatter plot is
displayed in the work area, you cannot create a box plot without
first removing the Y component of the plot.

 Loading...


