EasyManuals Logo

Texas Instruments TI-Nspire Software Guide

Texas Instruments TI-Nspire
380 pages
To Next Page IconTo Next Page
To Previous Page IconTo Previous Page
Page #284 background imageLoading...
Page #284 background image
272 Using Data & Statistics
From the Lists & Spreadsheet work area:
1. Select two columns of data listed in Lists & Spreadsheet by clicking
letter above the column.
2. Select Quick Graph tool from the Data tool menu to automatically
graph the selected data.
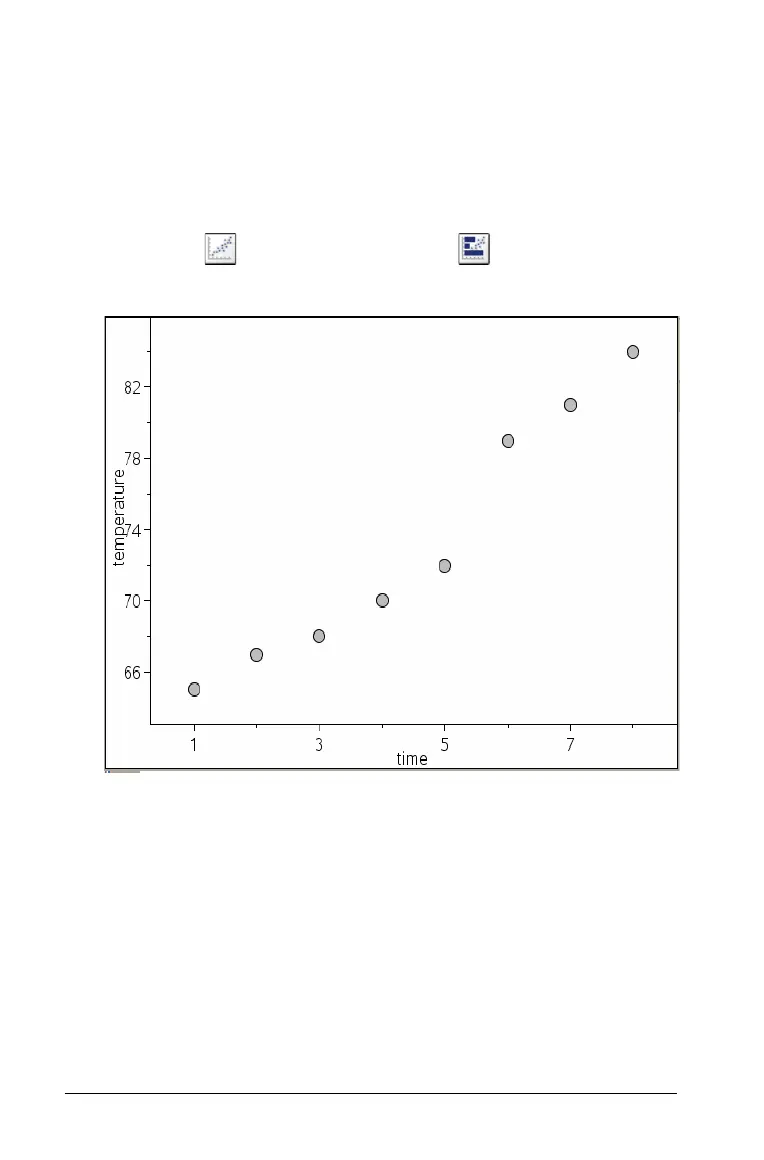
Note: If you choose not to use the Quick Graph tool, you can select
Scatter Plot from the Plot Type menu .
3. The data graphs on the Data & Statistics work area.
From the Data & Statistics work area:
1. In the Data & Statistics work area, click in the horizontal axis label
box, and select the variable that contains the data you want to see
represented on the horizontal axis.
2. Click the vertical axis label area, and select the variable that contains
the data you want to see represented on the vertical axis.
The data graphs in the Data & Statistics work area.

Table of Contents

Other manuals for Texas Instruments TI-Nspire

Questions and Answers:

Question and Answer IconNeed help?

Do you have a question about the Texas Instruments TI-Nspire and is the answer not in the manual?

Texas Instruments TI-Nspire Specifications

General IconGeneral
TypeDisplay
Form factorPocket
Product colorBlue, White
Display resolution320 x 240 pixels
Display size (HxV) (imperial)0 \
Compatible operating systemsWindows Vista/XP Mac OS X 10.4/10.5
Battery typeAAA
Number of batteries supported4
Weight and Dimensions IconWeight and Dimensions
Dimensions (WxDxH)100 x 198.3 x 28.7 mm

Related product manuals