212 Using Lists & Spreadsheet
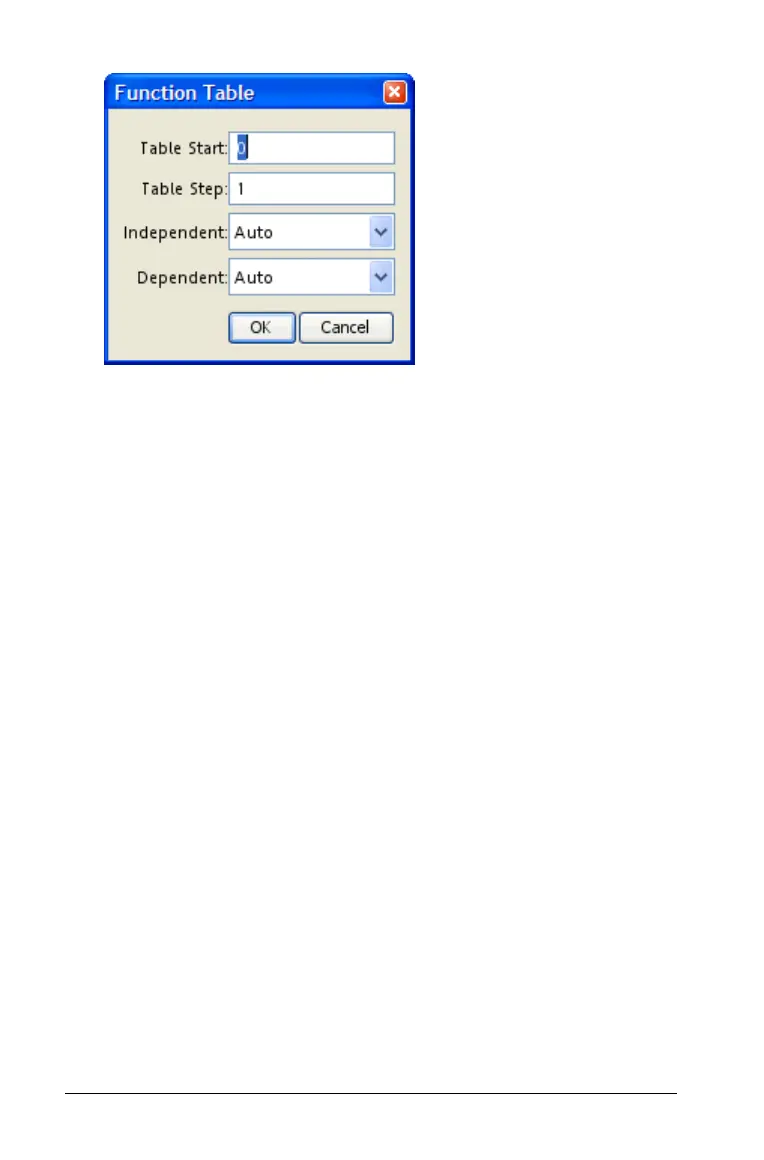
2. Type a value or click the independent or dependent variable boxes to
change a setting.
If you select Ask instead of Auto for a variable, you can enter a value
manually when you select a cell. Auto populates the table starting at
table start and displays and independent and dependent value for
each step.
Deleting a column in the function table
1. Click the function name or expression (in the top two rows).
2. Press Delete or Backspace.
Using table data for statistical analysis
Lists & Spreadsheet uses wizards to help you perform statistical analyses
on data in table columns. You specify the location of the data, and Lists &
Spreadsheet stores the results in two columns: one for the result names,
and one for the corresponding values.
Plotting statistical data
On some statistics wizards, there is a check box for Draw. By default, the
box is not checked. Checking this box creates a Data & Statistics work
area on the page, and displays the calculated results in Lists &
Spreadsheet and draws the results of the statistical analysis in the Data &
Statistics work area.
Note: The check box is displayed only if you select a header cell (second
cell from the top) before beginning the analysis.

 Loading...


