Using Data & Statistics 263
Showing Box Plot Outliers
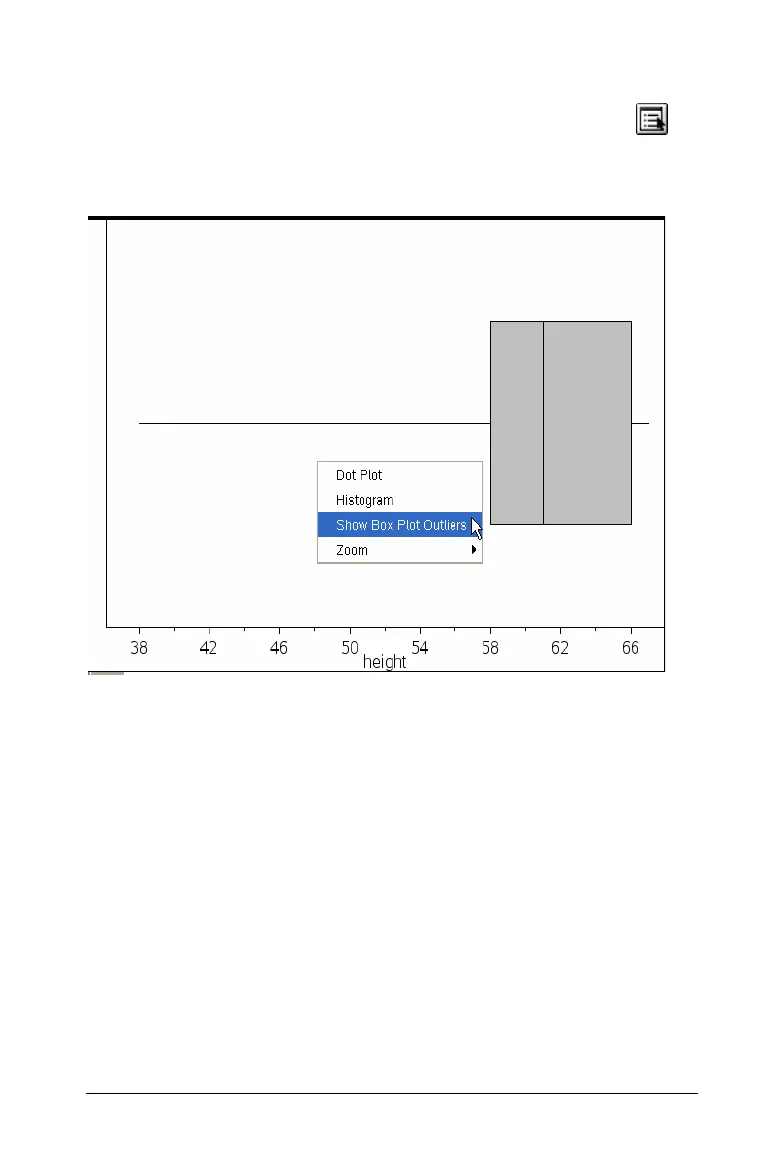
Select Show Box Plot Outliers from the Plot Properties tool menu to
stop whiskers at 1.5 * Interquartile Range and show outliers as individual
dots. You can also right-click and select Show BoxPlot Outliers from the
context menu.
Points beyond 1.5 * Interquartile Range display in the work area.

 Loading...


