258 Using Data & Statistics
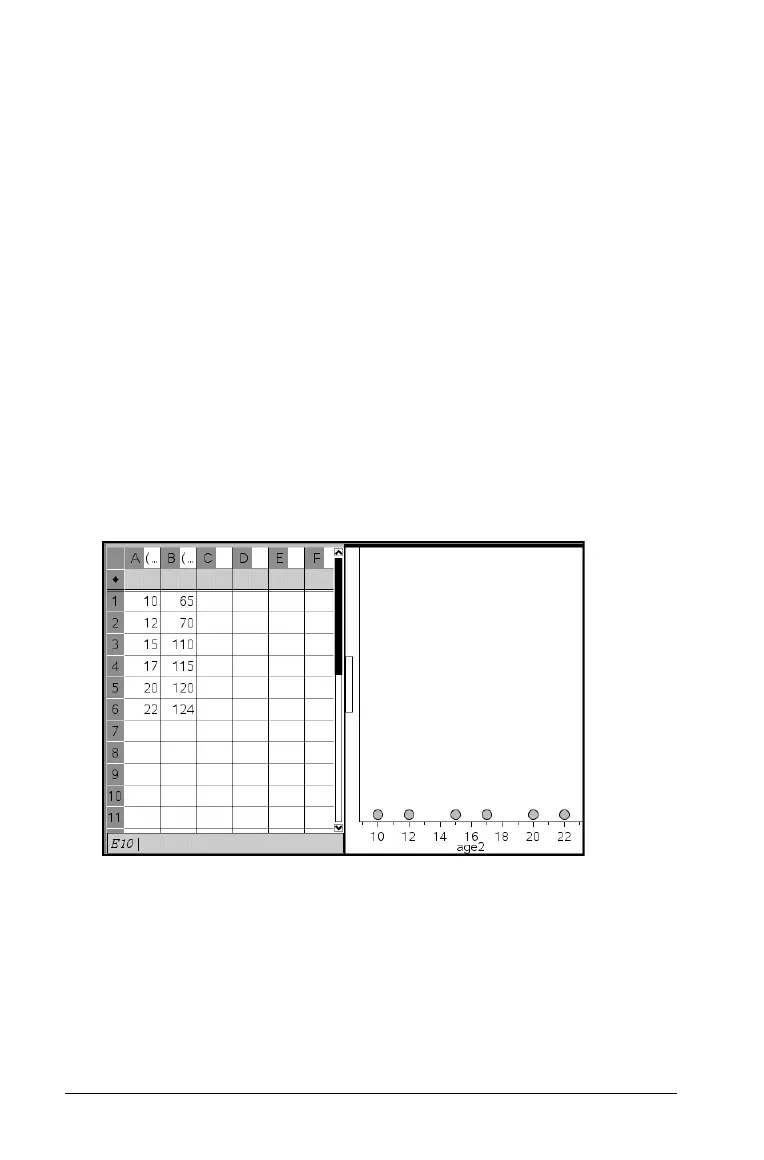
When one data set is plotted, the value of each cell is represented as one
dot, and the dots are stacked at the point on the axis that corresponds to
the cell value. By default, the horizontal axis is selected. The column
name is used as the axis label.
Creating a dot plot
1. Create and name a list of data in a column in Lists & Spreadsheet or
Calculator.
2. To create a dot plot, do one of the following:
• Select the column of data in Lists & Spreadsheet by clicking the
grey area next to the column name.
In the Lists & Spreadsheet work area, select Quick Graph from
the Data tool menu to automatically graph the selected data.
OR
• Click in the horizontal axis label in the Data & Statistics work
area, click and select the name of the variable containing the
data you want to see represented on the horizontal axis.
3. The data graphs in the Data & Statistics work area.
Click on any dot to display its value, or click and drag to change its
value. To deselect, click any area of the plot that does not include a
dot.

 Loading...


