EasyManuals Logo

Texas Instruments TI-Nspire Software Guide

Texas Instruments TI-Nspire
380 pages
To Next Page IconTo Next Page
To Previous Page IconTo Previous Page
Page #276 background imageLoading...
Page #276 background image
264 Using Data & Statistics
Note: If there are no points outside of 1.5 * Interquartile Range, there
may appear to be no change in the whisker display.
Histograms
A histogram plots one-variable data. Histograms depict the distribution
of data.
The number of bins displayed depends upon the number of data points
and the distribution of these points. You can adjust the bins’ width and
number by dragging the side of one bin in the work area.
A value that occurs on the edge of a bin is counted in the bin to the right.
Each bin width can be adjusted by clicking and dragging the side of the
bin.
Creating a histogram
1. Select the data you want to plot as a histogram.
2. From the Plot Types menu , select the Histogram tool .
3. The histogram plots on the Data & Statistics work area.

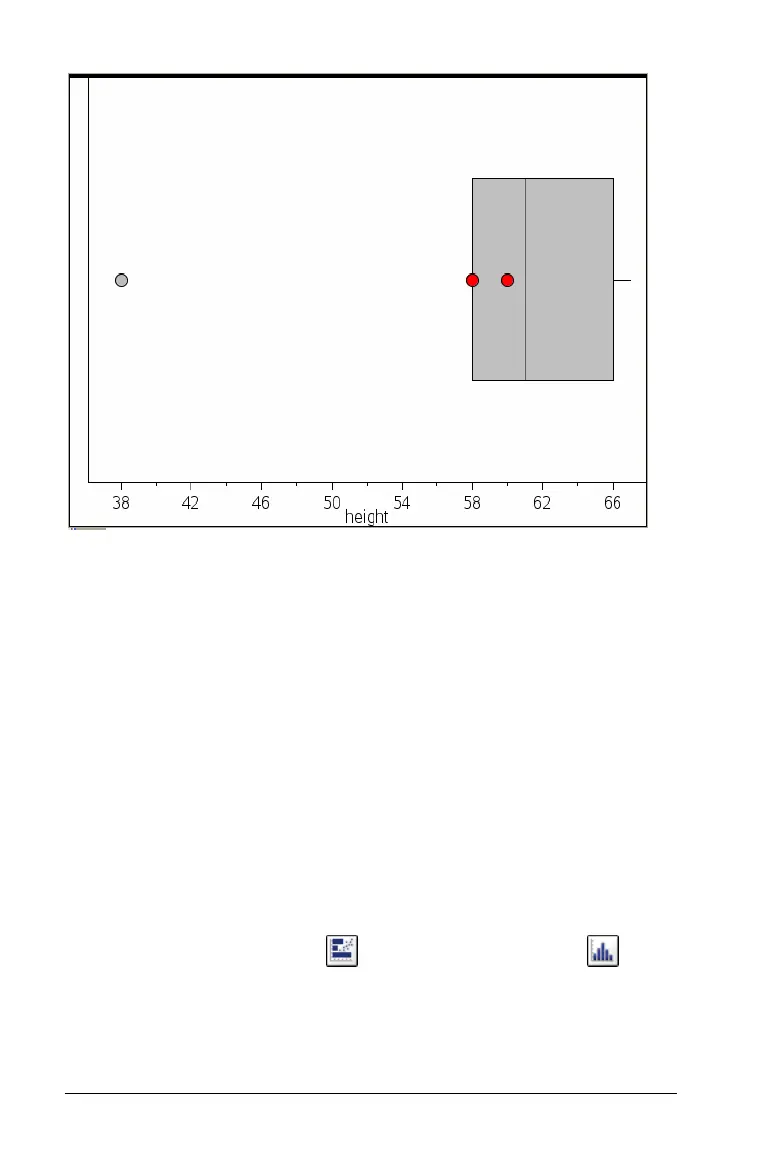
Table of Contents

Other manuals for Texas Instruments TI-Nspire

Questions and Answers:

Question and Answer IconNeed help?

Do you have a question about the Texas Instruments TI-Nspire and is the answer not in the manual?

Texas Instruments TI-Nspire Specifications

General IconGeneral
TypeDisplay
Form factorPocket
Product colorBlue, White
Display resolution320 x 240 pixels
Display size (HxV) (imperial)0 \
Compatible operating systemsWindows Vista/XP Mac OS X 10.4/10.5
Battery typeAAA
Number of batteries supported4
Weight and Dimensions IconWeight and Dimensions
Dimensions (WxDxH)100 x 198.3 x 28.7 mm

Related product manuals