Using Data & Statistics 257
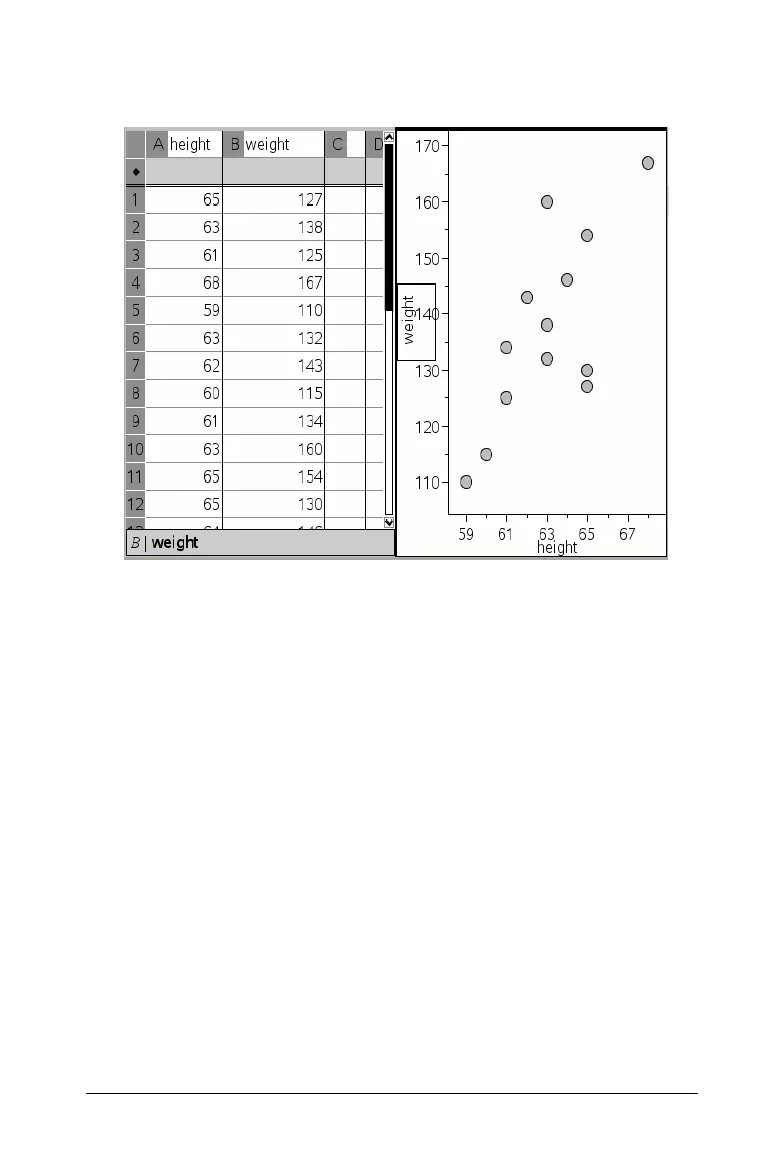
The contents of the columns height and weight are plotted as a
scatter plot.
Plot types
Plots let you visualize your data set in a variety of ways. Visualizing the
data points allows you to observe the shape and spread of the data, and
can help you determine the best method of statistically evaluating data.
Use Data & Statistics to create the following types of plots:
•Dot
•Box
• Histogram
• Normal Probability
•Scatter
• X-Y Line
Dot plots
Dot plots, also known as dot-frequency plots, represent one variable
data. Dot plots are the default plot type in Data & Statistics.

 Loading...


