Using Graphs & Geometry 99
Changing the thickness and style of a line/outline
You can control the thickness and appearance of the lines and outlines of
shapes that you create on the screen. To adjust the thickness of the lines:
1. From the Actions menu, select the Attributes tool ( ).
2. Select the object whose line you want to change.
Use 9 and : to move through the list of attributes.
3. Highlight the thickness option, and use 7 or 8 to move through the
thickness options.
As you move through the options, the thickness immediately
changes on the screen.
4. When the desired thickness displays on the screen, press
Enter or
click to confirm the change.
The Attributes bar disappears.
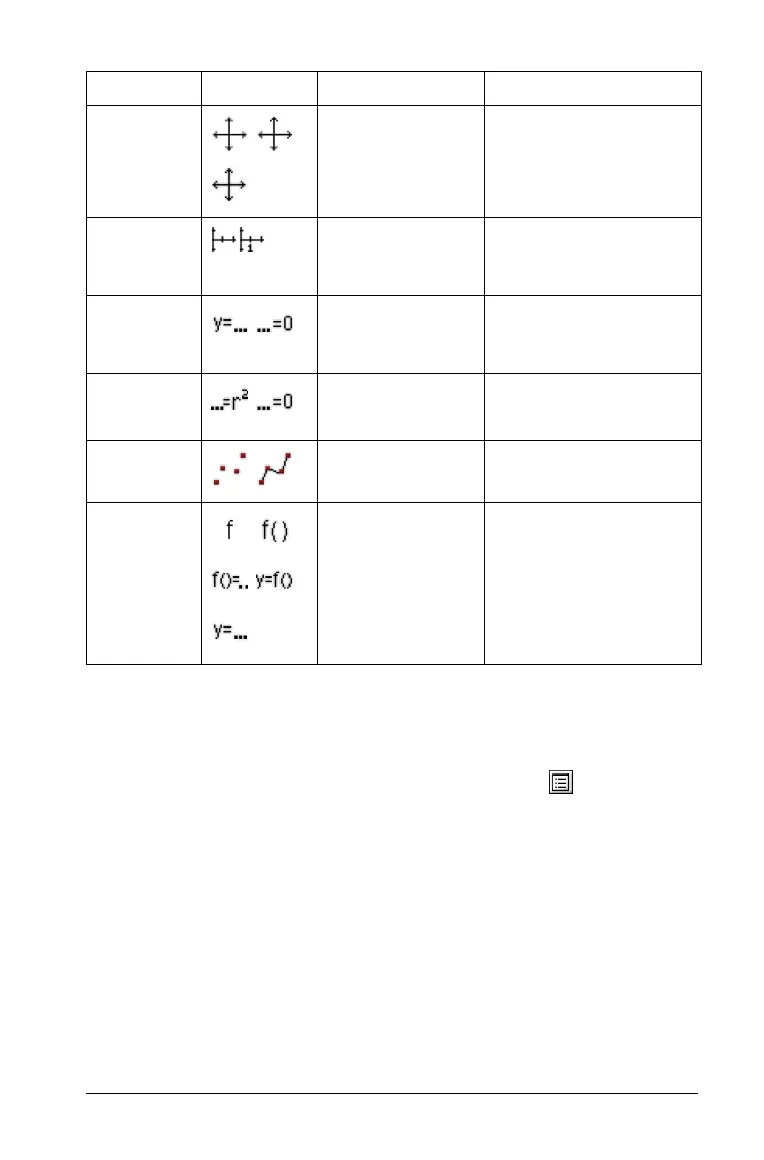
Axes End
Style
No Arrow, Positive
Arrows, All
Arrows
Axes
Axes Tic
Labels
Tic labels are
shown, Tic labels
are not shown
Axes
Line
Equation
Type
Cartesian (y=_),
Canonical (_=0)
Line, Tangent, Segment,
Ray, Vector
Equation
Type
Canonical (...=0),
Cartesian (...=r
2
)
Circle
Plot Points
Discrete Points,
Connected Points
Parametrics, Scatter
Plots, Polar equations
Labels
y=, f( ), f( )=,
y=f( ), f,
Graphed Functions
Name Icon(s) Options Available for use on

 Loading...


