292 Using Data & Statistics
Using Window/Zoom tools
Use the Window/Zoom tools to redefine the graph to better view
points of interest. The Window/Zoom tools include:
• Window Settings: displays a Window Settings dialog that lets you
enter the x-min, x-max, y-min, and y-max values for the axes.
• Zoom - Data : adjusts the zoom factor to display all plotted data.
• Zoom - In : lets you to define the center point of the zoom in
location. The Zoom In factor is approximately 2.
• Zoom - Out : lets you define the center point of the zoom out
location. The Zoom Out factor is approximately 2.
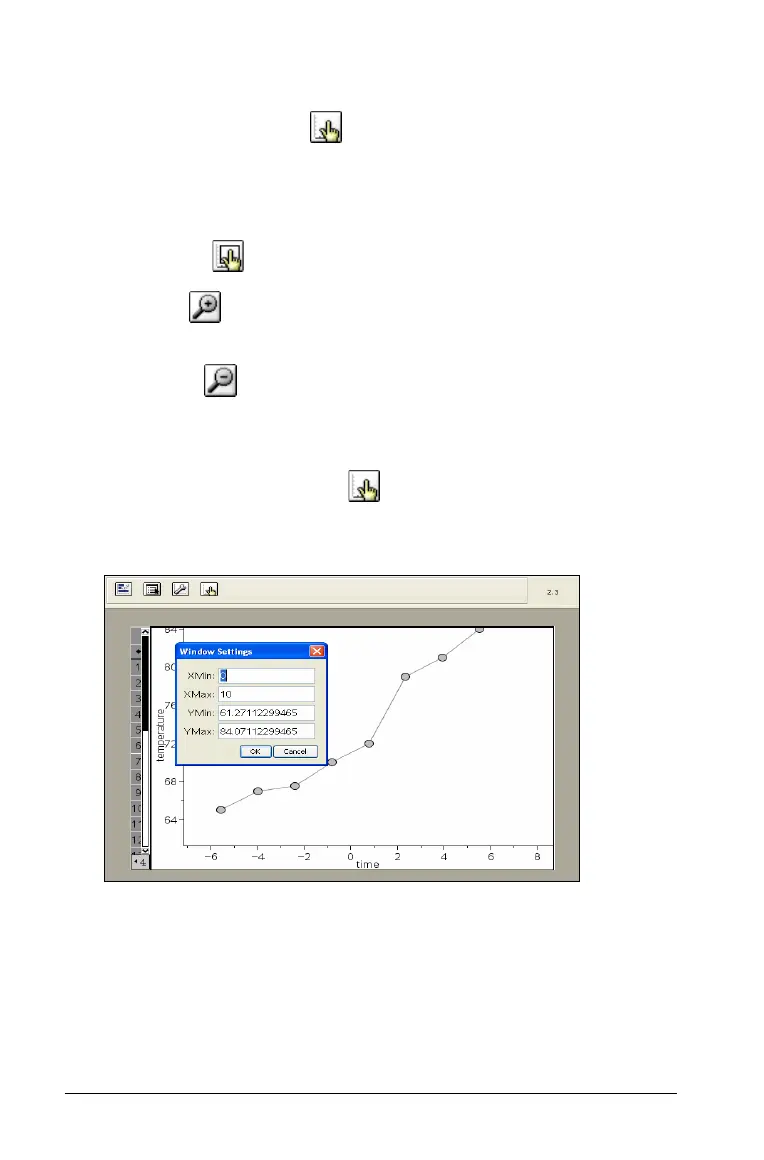
Using Window Settings
1. Click the Window/Zoom tool , and select Window Settings.
2. The Window Settings dialog opens. The current values for x-min,
x-max, y-min, and y-max display in the fields.
Note: Only the appropriate boxes are editable, depending on
whether there are one or two axes in the work area.
3. Type the new values over the old values.

 Loading...


